
I have been worrying about having promoted something I shared a few days ago from Dr Ben Miles mostly glib ‘sciency’ talk video which argues something which badly needs a better explanation. The thrust of his message is that with increased methane gas release from the planet since 2006, we are entering a period defined as an ‘Ice Age Termination Event’ which, because we are supposed to have just had one of those (around, he says, 12,000 BCE), is entirely unexpected. The implication being (and I have no idea how this can be rationalised) that as a result of the heat generated by the methane there will be another ice age developing. What?? Talk about a world out of control? It is madness.

It all depends on how you define an ‘Ice Age’. And that, I must admit is not an easy thing to do. At one point in his video, Miles flashes up the image below showing an ice-bound Earth and says something like (paraphrasing) “a rapid warming termed an ‘Ice Age Termination Event’, occuring approximately every 100,000 years, which within a couple of decades transforms a mostly ice-covered planet into a climate like we experience today”. This is absolute nonsense of course. Nothing, climate-wise, ever occurs within a couple of decades and we DO NOT have an ice age every 100,000 years. The man is a comprehensively educated noodle head, or, a deliberate deceiver. I think it is fair to say, in fact it is incontravertible to say, that the Earth has never been as pictured in that image. At least not in the past half billion years (according to all known science data). And we must trust the data. Science, in all its aspects, is really good at collecting data. Not so much, however, in its drawing of inferences from that data. So, is this just another scare tactic, promoting the global warming disaster meme, now losing out on all solidly based arguments? Arguments which are backed, incidentally, by most scientists who do not worship at the temple of personal wealth accumulation?
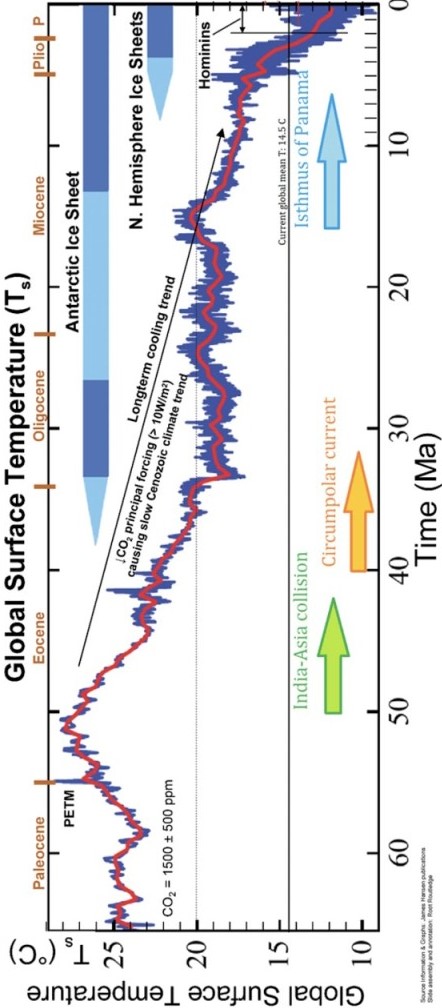
Take a look at the temperature over time chart below and you will immediately see that science data shows no period whatsoever where global temperatures have fallen below a trend-line average of 50°F, which is +10°C (not zero or minus ten). Nor, incidentally, has it risen much above 90°F in the same period, which is 32°C. And the average temperature has, for the most part, been mid-range between those two extremes. Real science tells us that an ice age begins (or ends) round about when polar ice-caps form (or disappear). And that only occurs at average global temperatures like 67°F or 22°C – shown as a line in the image below. Note also that the current Earth temperature stands at about 59°F or 14.5°C. I include the Fahrenheit equivalences only because the chart uses that scale. For the rest of this writing, that ends here.

You will also note that ice ages do not begin or end at the freezing point of water (0°C), and that Sea Ice (possibly only a few metres thick) is very different to a land-based Ice Sheet (up to several kilometres in thickness). Another incidental thing I must point out before we continue (I mentioned this a year ago when I first used this chart), take a look at the upstep at the rightmost end of the blue line. No such upstep exists. I suggest the chart was made by a North American source – since they are the only ones who doggedly still use the Fahrenheit scale and this upstep is obviously a devious ploy of disinformation (but I can find no better chart to illustrate the points I have made). The temperature line (whether red or blue) is meant to be a trend line (not absolute measurements). I hope you understand what a trend line is, and how it is calculated. I may explain that more later, but back to the point. The actual trend line, as I will show next, in order to obtain a relatively smooth average data flow, cannot be plotted more recently than around 100,000 years ago, even at the scale of the charts I show below. And at 100,000 BP (before present), the trend was still at around 12°C. Ergo, the line should end at its lowest point before the erroneous uptick in the above chart, i.e. around 12°C. This is further illustrated in the following two charts.
In the first one, showing the past 65 million years or so, which I have revolved 90° to the left in order to expand the scale, it can be seen that the red trend line does not reach the edge of the graph. This can be seen even more clearly in the further enlarged RH portion of the image. The gap is around 100,000 years or more.

Now look at the upper data line in the image below, showing only the recent 5+ million years. This time the trend line (coloured pale blue) ends between 100-200 thousand years BP. At this scale, and probably also used in the previous charts also, the trend line uses a 3-4 hundred thousand periodicity in its moving average calculated trend plot. And look where it sits – again at around the 12°C level for at least the last million years. For now, we can do some intelligent guessing at where it may be in the future. To my eye, and without having the raw data as a guide, there appear to be roughly an equal number data plot points laying above and below the most recent trend calculation, signaling that there is very little, if any, change in its position somewhere below 12°C.
This indicates that the trend will continue more or less along its current path. That is very satisfying and reassuring to know. No need for panic of any kind. And, tell me if I’m wrong (without blinding me with science), the trend line is now almost horizontal at this scale (and reflects that, though not so obviously in the previous chart). This is truly ‘momentous’ – which the Cambridge Dictionary defines as: ‘very important because of effects on future events‘. I will explain. But first, the line is not quite horizontal. In fact it has fallen around 0.5°C in the last million years and 2.5°C in the last 3 million years. We had better hope it does actually stop falling another 2.5°C in the next 3 million, putting it into territory of below 10°C average temperatures. An area in which it has never previously traveled during the whole of Earth’s history. Not that that is of any concern to us living now, nor to our descendants for many, many, generations to come. You now, I hope, have some better understanding of just where we sit at this time of a great many other pressing situations.
Note: I have edited this image to show approximate Celsius temperatures in the RH border, for clarity.

How do you define an ‘Ice Age Termination Event’? In fact, when it comes to basics, how do you define an ‘Ice Age’? Does an ice age begin when polar ice-caps form and end when they melt away? Does a certain global average temperature, like the 22°C I mentioned earlier, mark those points? Various definitions mention both of those markers. And I don’t see any other contenders.
If that is true, then the Earth has been in an ice age for the past 38 to 40 million years, not the 3 million years (actually 3 to 6 million) some sources state – presumably based on the temperature level which slipped back up through the ice sheet boundary for a brief while around 14 million years ago. But that 3 million years BP event, whatever it was, and I can’t spare the time to look, was not the beginning, or ending, of an ice age event. Although it was fairly close to the formation of Northern Hemisphere ice sheets, the joining of the Americas at Panama (the final major movement of continental land masses, which began not many millions of years before the Antarctic ice sheets formed), the beginning of the Circumpolar Current and the beginning of the Gulf Stream. That period between 40 and 3 million years ago was one of massive changes on the face of planet Earth – part of which was a rapid fall of atmospheric CO2 from around 1200 ppm to around 280 ppm (I think, from memory) and a disastrous fall in global average temperatures, from about 20°C down to the current less than 12°C today. Like I said before and I think is worth reiterating, we better hope it doesn’t fall much further. The signs are there that it won’t.
The reader should already have noticed that the things I am talking about – which most scientists would agree with, I think (see the Global Climate Declaration, 2023), are not in concert in any way with the stories the general public are being fed – and expected to swallow, hook, line and sinker, by so-called experts backed by corrupt scientists and subscribed to by self-interested wealth centers. Decide for yourself who is right. Don’t just take my word for it. You need to be sure.
And when you are sure, you can confidently say that the Global Mean Average Temperature of planet Earth has dropped a full 16°C from around ~28°C 50 million years ago to the current ~12°C today. Doesn’t that bring a confidently wry smile of satisfaction and relief to your face, in just knowing that, when all those silly folks who are concerned about a less than robust forecast of a 1.5 to 2°C potential rise in coming years? How stupid of us to allow ourselves to get so worked up over so little.
Now, let’s move on. All that I have said so far has been about the long term temperature trend, and that should be the primary background focus for all discussions on temperature variations within climate change. That trend is not cyclic. It is more to do with the gradual cooling of the planet from its ancient birth (which I have also discussed previously under another subject heading) to is final state – hopefully a long time in the future – as a dead or star destroyed planet. There are other climate forcings of a more or less cyclic rather than linear nature. I have also written extensively about those. They have a general but irregular periodicity of around 120,000 years, usually consisting of a ‘rapid’ rise in temperature of 5-6°C from the standard planetary base of ~10°C up to ~15°C. Those rises taking place over a period of around 12-15,000 years (not a couple of decades as Dr Miles incorrectly suggests), followed by a gradual cooling period, down to the base level again, to complete the remainder of the ~120,000 year cycle. Sometimes there are mini-cycles (rises and falls) within that cooling period which are fully explainable (but not by me and not here).
I think the general confusion for the public (and also, it seems, for Dr Miles) is that we have just reached the peak of the current cycle rising temperature period. We have risen a full 5°C, perhaps a little more, from the end of the previous cycle which ended around 17,000 years ago (almost immediately followed by another brief freezing, both events being externally caused and therefore not meeting the definition of ‘Ice Age Termination Event’, the second of those events which we know of as the Younger Dryas period). Perhaps this twin event is what put the idea of unusually closely placed termination events into the mind of Dr Miles. Hmm… interesting. Whatever the case may be, we are now set for the long gradual cooling period of the current 120,000 year cycle, just begun.
This is why most scientists and the original climate dissenters (with more and more people joining them – including myself) disagree with current climate hysteria. It’s so obviously incorrect.
What about ‘heat generated by the methane’ increasing since 2006? How does that effect things?
Where Dr Miles goes wrong (and I can say it no other way) is that he conflates the current situation – increased temperature from increased methane release since 2006 – with the precipitation of a new ‘Ice Age Termination Event’. Which is, to put it mildly, total bunkum. No wonder he doesn’t know what is causing it. But was there any need to turn the situation into a cause for panic? And there has been no recent such event for what we are seeing now to ‘closely follow’ – to use his words.
There has, in fact, been no ‘Ice Age Termination Event’ since the end of the previous ice age, some 170 million years ago (check the first chart), unless you count the brief – about a million years duration some 15 million years ago (check the second chart). But that is inadmissible as an ice age termination event since it meets only the temperature condition for such events, not the ice-cap condition. That was before the formation of the Northern ice sheets but smack in the middle of the Antarctic ice cap period. We will not see an ice age termination event possibly for millions of years to come.
Scientists who want to make a point for general consumption should check their definitions, since that is something even a relative layman like myself can understand.
I have run out of patience now, and so will end this here. It seems to be an appropriate point anyway.

Leave a comment