
Another month has passed and some quite interesting things have occurred, relative to the modern climate change hysteria pill much of the world has swallowed.
Forget about Trump’s lunatic logic, or the fake science data from overworked computers and less than ethical minds. There are real facts to digest …well, if we have confidence in actual science data any more. You know… supposedly untouched and unmanipulated data provided by some of the best data collection methods at our disposal today. Not everybody is interested in twisting the truth. Some scientists still retain their own integrity in the daily practices they perform. Perhaps even a majority. It is in the interpretation of data (or the procurement of false or irrelevant data) that opportunity occurs for the drawing of false conclusions on which much of modern climate science rests.
I place trust in the data provided by NSIDC and other North American scientific institutions because, well, it is still the best we have to work with. Largely based on actual readings, not computer models – as far as I know. Enough said on that. If I had access to equivalent Russian or Chinese data, I would do some comparisons. But I don’t.
The data for the end of September is now in, and it shows a more promising situation than might have been expected, and reveals some useful trends. Here is the image produced on the NSIDC interactive climate charts for Arctic Sea Ice. This time I have included the decadal average ice extent lines for all four decades since satellite data became available, because I want to show something important that can only be seen from distant results.
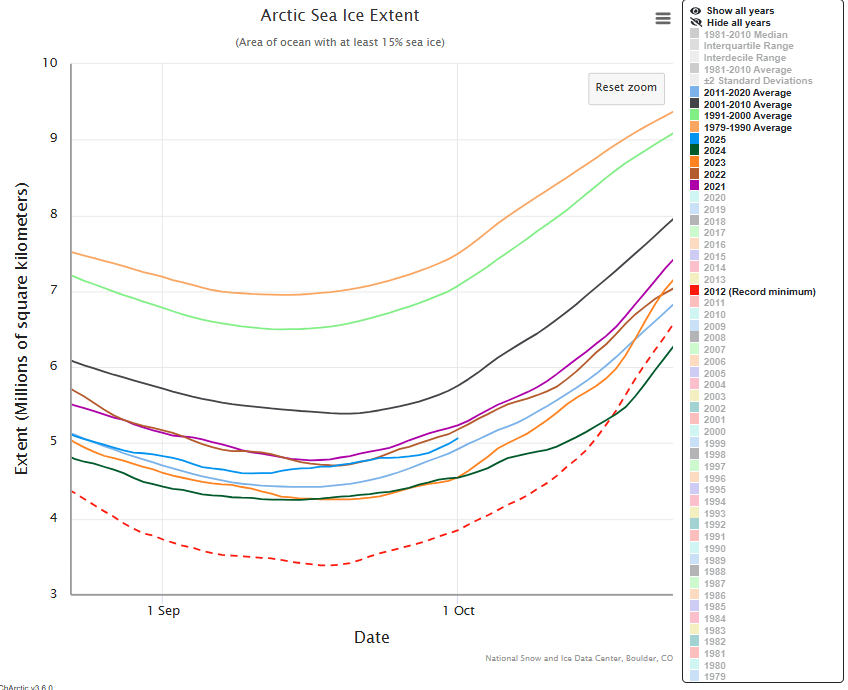
As at the end of September, there were 5.067 million Km2 of sea ice remaining over Arctic ocean waters. Again this is considerably higher than the the average ice retention for the previous decade at the same time of year. But, unfortunately, not enough more to provide a positive current half decade average result for recent years. This is due only to the excessively poor result of the past two years (’23&’24) arising from late ending Summer heat (a digression unlikely to recur, I think), as can be seen from the chart.
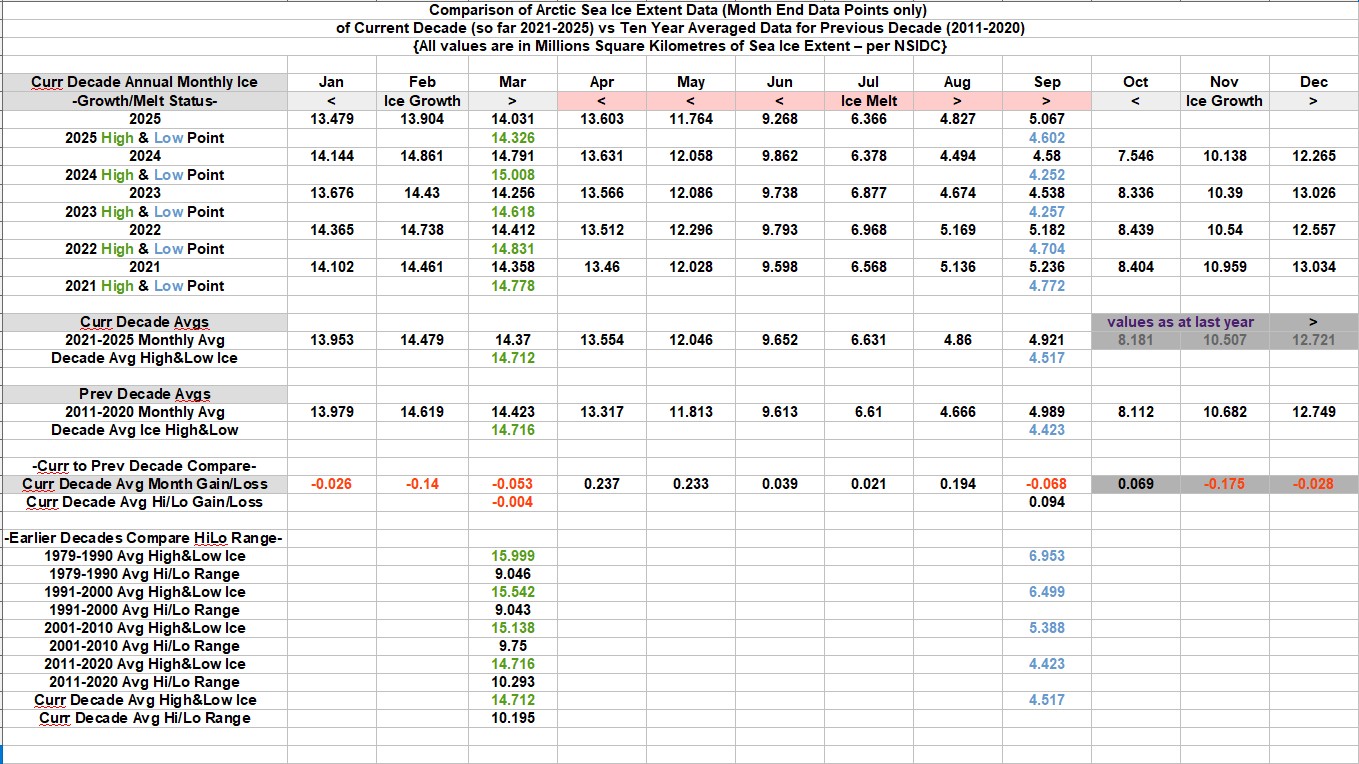
All of the data has been added to the monthly spreadsheet below. Which has been expanded this month, as I mentioned.
So, what can we see from this data?
Looking at the end September ice extent, this is (following two years of below 5 million Km2 remaining ice) back in excess of 5 million. Clearly, something is happening (which others have also noticed), and while it is less clear just now, this could be the beginning of a turning point.
Another new addition I have added this month is the recording of annual ice low points as well as the high points added recently. This allows us to see whether there are changes in the range in decadal change ice coverage. The Summer low point (peak melt) is seen to be third highest of the five years so far in the current decade, and is also higher than the average for the previous decade (some 94,000 square kilometres higher). All of these results are individually minor in nature but, taken together, may eventually prove to be a more significant movement in future trends – which is all I am seeking from the current decade. If there is any hope, other than strong significance from background long-term historical evidence that such change is due to occur about now, then we need – and should expect to see – such trends in action. I believe this is exactly what we are seeing here.
What else is there?
How does the current decade Winter ice build and Summer ice melt compare to that of the previous decade? This is a small trend, but of interest nevertheless. One can intuitively suggest that if the Earth is cooling, this is the closest point at which Winter growth in ice formation would be noticed. And if it were warming, vice versa. Well… at only 4,000 square kilometres difference between decades, due exclusively to the poor ice build this year, this is virtually a situation of status quo. But as for Summer melt, well… some 94,000 square kilometres more of Summer ice has been retained this decade on average than in the previous decade. That is beginning to look significant.
Final, and perhaps providing the most significant points so far, I have also calculated and added the ice range movements of all four previous decades to give a longer-term trend view of gains and losses.
The first trend to notice is in the decadal Summer peak ice melt values, which are (let me paraphrase), beginning with about 7 million Km2 in the ’80s, then around 6.5 million, then less than 5.5 million, less than 4.5 million in subsequent decades to a little above 4.5 million – a trend change – in the current half decade. I fully expect to see that to play out at around 5 million (or more) by the end of this decade. Such values represent a significant trend change occurring this very decade. But that is only half of it.
The second trend to notice, though not so intensive, is the decadal Winter ice build, or reformation. The values are, around 16 million Km2 in the ’80s, to around 15.5 million, 15 million, then 14.5 million in the 2010s, where it has remained steady into this decade, so far – but which I have good reason to believe will reach back up to 15 million Km2 by the end of the decade (because of another quite separate trend).
But first we must look at the combined efforts of these two trends (ice growth and ice melt) since they act together in the annual dance of Arctic sea ice coverage. Something quite revealing, and perhaps unexpected, is the result. We now have the data to see what is the nett effect of these movements, and it is this…
There has been an average increase in Arctic sea ice coverage, over the past +four decades, of at least 1 million and perhaps (if my suggested increases materialize) 2 million Km2, across each annual progression between high and low values. The values range from 9 million to 11 million, currently sitting at a little over 10 million Km2, half way through the decade, as can be seen in the bottom group of data in the spreadsheet. This is because while the ice building and ice remaining values are both going down (at different rates) and, additionally, that trend is in process of reversing, all of this means that throughout the satellite period of +four decades, the average range of ice coverage has actually been all the while increasing.
And that, being the opposite of what all the climate hysteria noise keeps blaring at us, is something to actually make some noise of our own about.
Now, basking in those hope renewing and clarifying thoughts, to see what better ice building we can hope for from the rest of the year. Not that we want to see excessive amounts of ice in that region. I quite like being warm. But the expected colder climate we should expect to eventually emerge is not for us, I hope, but, gradually, for some far distant generation of mankind who will have ample opportunities to get ready for it. And most likely without noticing much change in their own lifetimes either.

Leave a comment