
With all the talk of potential missing data issues – which turned out to be nothing much at all (so why did they make such a huge fuss about it?), I didn’t finish off what I wanted to say about the July 2025 Arctic Sea Ice situation, so here goes…
The August 1 data came in (maybe a day late) and I updated my spreadsheet as seen below. This turned out to be a slightly more positive result for ice extent than I had hoped, at 6.366 million Km2. Which is good. Enough said on that now, except to repeat that this is now four straight months of average more sea ice at month end than the average for the previous decade at the same annual time points.
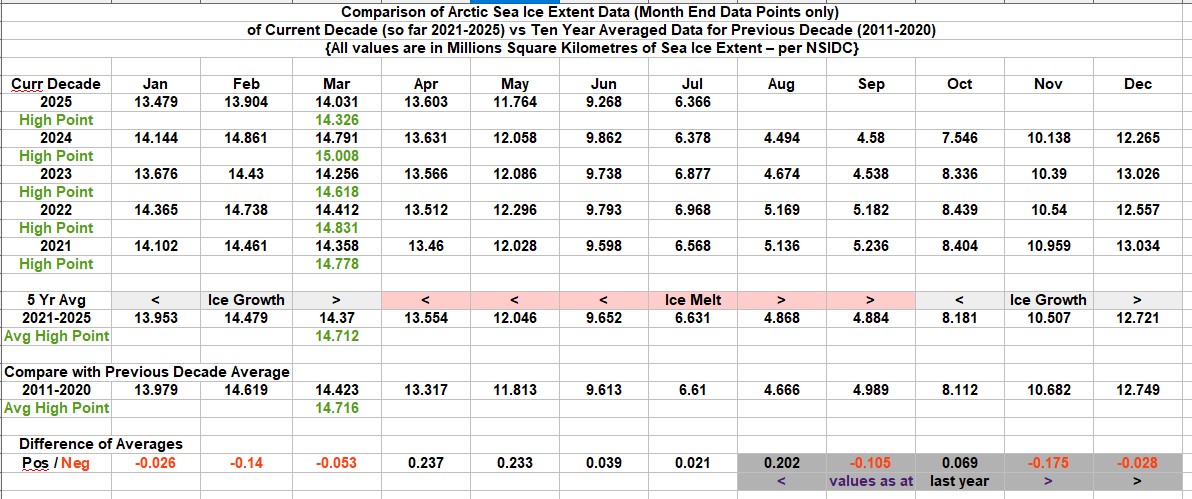
…and unless things go really badly during August – really the final month of Summer, as far as ice melt goes – there will be a fifth month positive for August (the target is not less than 3.9 million Km2 ice remaining, which is eminently achievable).
So, I look forward to the August records. September is peak melt month but it always (except for last year) finishes with more ice than it began with. There is an observable general rule for the highs and lows of Arctic sea ice. A low ice build-up over Winter, generally produces less melted ice in Summer. The converse is also true. We will soon see if that holds for the current year. Here is a chart which I think supports that idea…
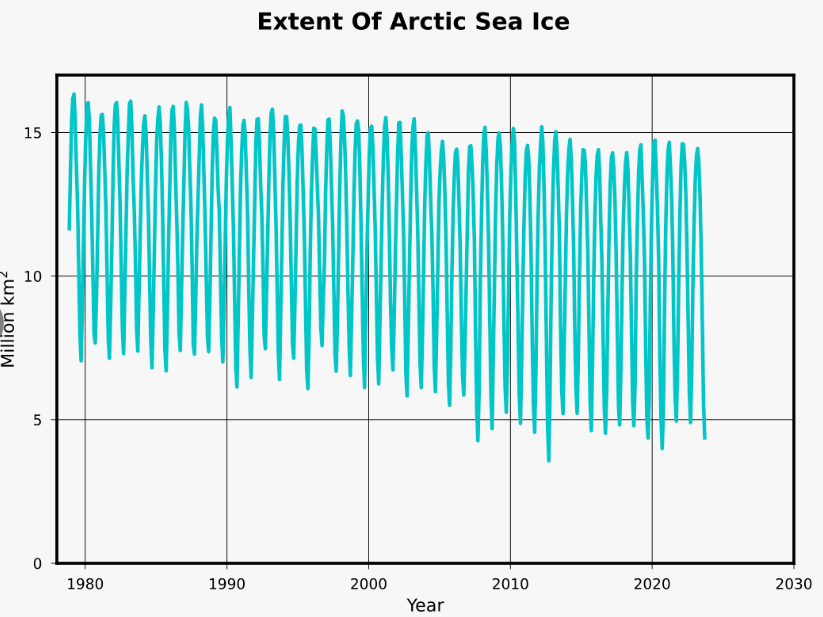
This compressed chart of extent data, actually shows a quite healthy picture of the annual ebbs and flows of the Arctic sea ice mass. The Winter ice build season has not in any way collapsed, as is often suggested. There is seen to be a Winter loss of little more than a million Km2 over the 46 year period (Winters at the top, Summers at the bottom), but that appears to have stabilised for the last twenty some years at least. So we do not have an ice crashing situation at all. In a mild warming inter-glacial period you would expect some ice loss due to increased melting, and that is also visible – but not at all a catastrophic situation. There cannot be claimed to be more than a 2 million Km2 deficit over the same period. One million of that is covered by the smaller ice build (also expected due to increased warming), so the net loss across the Summers is in fact only one million Km2 – exacerbated by only three years of excessive losses – which is not countable, since the other years in the last fifteen or so, have remained more or less stable. There is a lot of unnecessary fuss generated over sea ice loss, which is quite unsupportable when viewed in light of the data.
The chart only covers up to Summer 2023 as you may have realised. The up-line of Winter always preceding the down-line of Summer, of the same year (just to hopefully avoid confusion).

Leave a comment