
Yesterday, you may have seen the article below in my report on Arctic Sea Ice as at end July, 2025, where I promised to say more about it soon. Well, there is a daily update August 1 now, but whether this is just a late last update from the old system, I don’t know, and we may still have to wait for further updates emerging until NSIDC has integrated the replacement JAXA data into their system.
Until then, this story explains in more detail why the change is occurring.
No, Space.com, Cutoff of Satellite Sea-Ice Data Won’t Make Any Difference – Anthony Watts – Climate Realism – July 15, 2025
I think it is quite self-explanatory, but there is something in it that I have found to be disturbing, partly to my own personal views and also to the work I have been doing for the past eighteen months to show that something is happening with Arctic sea ice that has gone largely unnoticed. And that gives me cause to amend my stated view over that time period on my theory that sea ice melt has stabilised in the current decade, and may in fact be reversing. I am, of course, always open to such identifiable adjustments. That change will not effect my work but will add to it as an expansion across a broader timeframe of past recorded data. I will keep observing at the leading edge of developments, which of course is time limited – being concerned with what happens in the future, as it unfolds – which is infinitely more important to observers, as it rolls out so very slowly in front of us.
Meanwhile, this new information – looking further back as it does – provides both a stronger backing and a welcome hope that the image we hold of the normalcy of current climate change, holds good for the future of our world, rather than the terror we have been led to believe by unscrupulous people in authority.
Within that article by Anthony Watts, of Climate Realism, is the image below, which should explain what I have been saying…
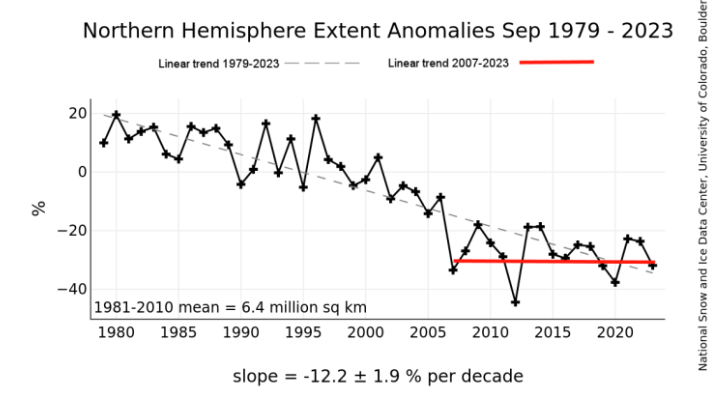
This is an image of September (Summer) annual low points in sea ice melt. While it shows only three years of the current decade, as I have been showing for months now, this decade is demonstrating an abrupt halt to further expansion of sea ice melt in the Arctic. That still holds good, as my monthly spreadsheets, including the latest one show. And the good news is that this feature actually holds good even across the previous decade (See the red line in the image) – at least for now – which is why it is important to see what happens in the near future.
This does obviously require some further explanation – and some new charted data, rather than the perhaps less than useful anomalies shown above. I have more work to do on this, but it takes time, and I will report later.

Leave a comment