
I’m talking about the situation regarding Arctic Sea Ice this month. It’s very strange, but also very encouraging.
In the chart below (based on NSIDC Charctic Sea Ice Data), I have selected for display, the three decade median line (1981-2010), plus the four individual decade average lines covering all complete decades of data so far collected in the satellite era, and also the annual data line for this year (2025). These are the bolded text in the Legend at right of image. And I have shown the whole year’s data (year so far for 2025) because I wish to make a few points below.
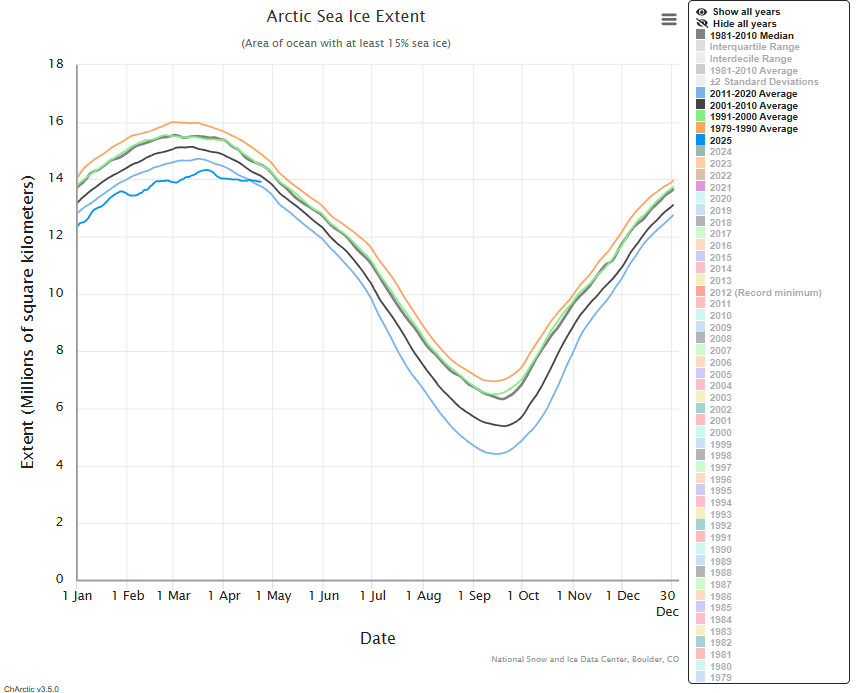
The thick grey line, is seen twirling around the green line – as it should be – that being the middle decade of the three of which it displays the median values.
The smoky blue decade line for 2011-2020 is our yardstick for measuring what is happening in the current decade (it represents the average data for the previous decade) – and that is not what you might think.
There are a few interesting points which can be made here, the first being that there is far less variance in the degree of difference between succeeding decades during the main Winter ice formation months (Jan to Mar) than there is during the main Summer ice melting months (Jul to Sep). Meaning that of the two prime changes we should be looking for here – more ice building; less ice melting over the year – assuming that we have already reached the peak of the temporary inter-glacial period (which I have suggested is the case, though not yet provable), is that there need to be only small average increasings in amount of ice built across a decade, when compared to decreasings of ice melt in the same decade.
Incidentally, I do not refer to ice-melt as ice-loss. That is both incorrect and misleading. The cold, slippery stuff grows back again. And it would be, in fact is, only natural to expect more ice-melt than ice-build at a peak of inter-glacial warming. It doesn’t mean we need to make the sort of fuss scientists love to make on the subject. It’s completely natural – and will end. That is even happening right now, if we care to look.
The second point is that it appears that both peak of ice-build and peak of ice-melt are changing in the time they occur. Look at the four decade lines. It is clear that the peak has moved by a couple of weeks, from end February in the 1980s to around mid March. And while the current decade has been a mixed bag, leaning toward mid March again, this year the peak was in the third week of March. It will be interesting to see what the remaining five years of the decade will produce, but such variation at this time may also be signalling change is in the air. Meanwhile, at the Summer peak ther has been movement too. The median line shows (and this is why I included it) a distinct move to the right from the first (80s) decade. This is surely due to the sharp move in that direction by the first major melt decade of the period, the 2001-2010 period – where, for the first time in the modern era, over a million Km2 of ice melted. THe same level of melt also occurred in the 2011-2020 decade, but the swing in the peak time reverted back to the left again. Is this another indicator of change? I can’t tell you that, but it is interesting – and something to watch for, because three of the four prior years of the current decade had peaks in the third week of September while last year, 2024, again moved to the left. What will 2025 do?
What does it mean if Summer melting peak moves earlier by a week or two and Winter building peak moves later by a similar amount? It means that the melting season becomes about a month shorter, while ice-building a month longer. See the importance of noticing small details when building an image of change? It is the little things that count and together amount eventually to something undeniable.
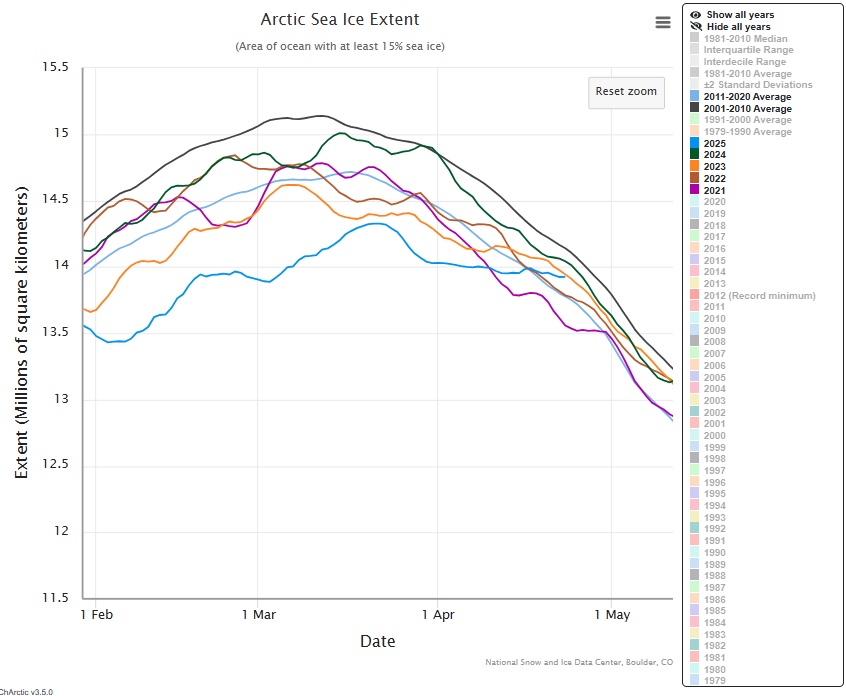
I think I have covered what I wanted to say about the first chart. Let’s move on to this year’s ice building, with its remarkably late peak and its reluctance to turn into the normal melting phase. No better shown in the first image, where it has clearly passed the marker for average for 2011-2020 and is marching on, in an almost straight line, toward the marker for 2001-2010. But equally importantly as shown in the second image alongside its current decade partner years.
Who would have believed this a year or two ago. Well, me, actually. Not patting myself on the back, but, well, in times of change strange things happen. If only we could convince climate scientists of that. Take a look at the second image. Do I need to say any more?
2025 has brought the third largest amount of sea ice in the current decade (as at date of writing), will soon be second largest and may also get to top spot. That is an amazing recovery from being the slowest and lowest ice forming year prior to almost a month ago.
I say this repeatedly, but I’m going to say it again. I believe, and every point I notice about Arctic climate issues serves to add confirmation of it (not necessarily as yet, of proof), that we are in the early stages of post-peak inter-glacial warming occurring this decade, the 2020s. All signs point to it being so. It’s just that we don’t have enough data at this point to be absolutely certain. What we do know for certain, is that this change, if not now (and I remain convinced ‘now’ is the time), then very soon, that change will be upon us. How embarrassing that will be for all those who have continued to crow about catastrophic climate change for years. I did that too of course, but I woke up to reality, Seeing things as they are. Not necessarily the same story as many climate scientists have been espousing for decades. Those people, whether activists, scientists, government offcials, whoever, are the deluded or deliberate enemies of mankind. They should be dealt with appropriately, because they are destroying our world over some impossible notion that we are to blame for perfectly natural planetary behaviour. They expect a future that will never arrive, and if they get their way, we will never survive. Because Zero Emissions mean Zero Life.
I will be updating my sea ice spreadsheet in about a week.

Leave a comment