
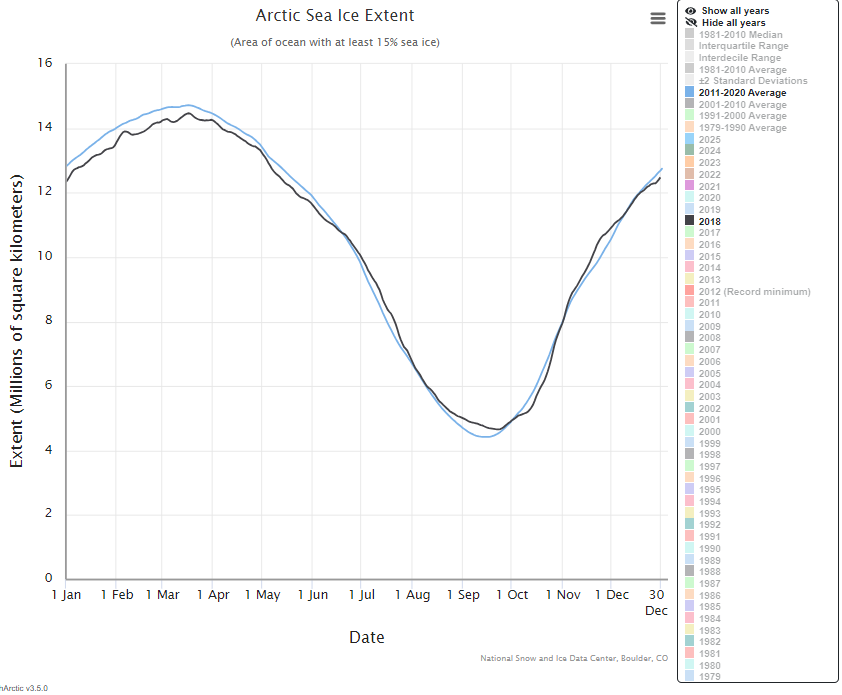
Well, the NSIDC Arctic Sea Ice graph line having now reached the ‘1Feb’ vertical, it is time for me to say something more on the Arctic Sea Ice question. Let’s just say that this has not been the best month at year start on record. In fact it is the second only most worst month so far recorded in the modern era. The worst being that of January 2018, toward the end of the previous disastrous decade. But let’s examine this a little further.
First let’s look at just 2018 compared to the average for the decade it was part of.
2018 was, overall, actually quite an average year for Arctic Sea Ice in that decade, spending rather more time above the ten year average than below it. However, it never reached the average ice formation peak level for the decade, but after a low start (a little below that of this year – 2025), the year remained below that average line until mid June and then switched to above average for most of the rest of the year except mostly for a couple of weeks in October, and displayed no signs of an attempt at a peak Summer melting record.
Is this what we could expect for 2025? Hard to say, because of the annual variability, which is subject to short-term weather more than to climate factors. I expect now, that something similar will take place this year also. But we must not, as I am often warning, take any single year in isolation.
So, let’s see how this months adventures look on the NSIDC Sea Ice graphs. In the second image below, I have added the year 2018 for a more detailed comparison.
Not a pretty picture, so I won’t dwell on it. I expect to see something entirely different in February.
So far this decade, ice growth and retention has largely remained higher that that of the previous decade and, overall, I expect that to remain the situation for the rest of the current decade. But, of course, that remains to be seen. I have no doubt 2025 will not vary markedly from this. It is though, now likely that this year will not reach even the average peak for ice build in the previous decade, which is very disappointing but it should not effect the current decade average. There is always a possibility that one year out of ten will not play the game, and that seems to happen once or twice in every decade. But in fact, what we have seen so far is a very remarkable achievement that seems to have been largely unnoticed by the professional climatologists – whose attention is focused on materially unimportant weather features, rather than what they should be looking at – which is overall trends – instead of trying to scare uninformed folks with lurid tales of catastrophic consequences of their own fantasies.
This poor start to the year has certainly brought the end of January average for this decade down below that of the previous decade, which is, again, disappointing for me but not critical and the amount is almost undetectable at some 26,000 Km2 of sea ice, below the previous average. Peanuts when talking of millions, not thousands.
I have updated (and tidied up) the spreadsheet I used last month for end of 2024 to include this latest data and to ease the burden of calculations (and errors) for me. It has been many years since I produced any such work and I required some memory refreshing on the formulation of formulas.

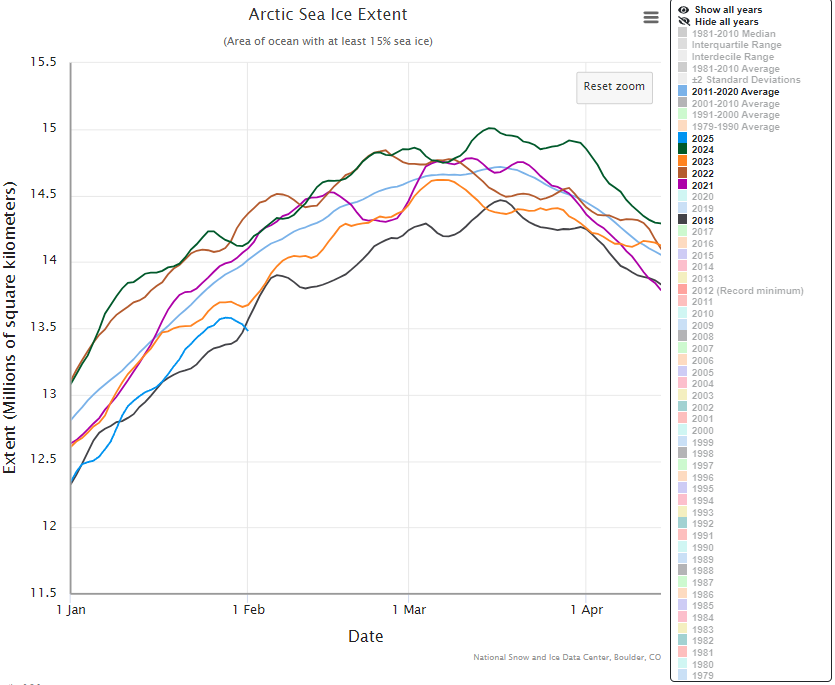
January 2025 has seen a normal amount of growth in ice coverage, at around 1.2 million square kilometres but, due to the poor end-of-year performance of December 2024, was given a supreme challenge to meet and has failed to more than marginally cut the deficit it inherited. I expect better results from February which gives a slightly lower target to meet.
I have always based my thoughts on Polar matters mainly on the US NSIDC data. There is an element of distrust on anything out of the US these days. They are inveterate liars and deceivers generally. But I don’t think US science has inevitably degraded to the point of producing fake scientific data, yet (except perhaps in the military field, in history, and about their own achievements). If I suspected deceit in this area, I would openly say so. Only today I thought ‘Surely the Russians must have something similar?’, meaning a Polar scientific establishment. We don’t hear much of such of course, as a result of western suppression of anything not of the west, but the Russians are not dumb – in any field of endeavour and knowledge – quite the contrary. I discovered that Russia does have extensive scientific interests in both Arctic and Antarctic regions.
Their main scientific body appears to be the ‘Arctic and Antarctic Research Institute’ (AARI) which also has a frequently updated VKontakte (VK) page that is full of interesting information for Polar region enthusiasts. I haven’t yet found a data source such as that used by NSIDC for its ice charts, but will keep looking. It would be good to have more than one set of data results to compare in matters like this, when a single source could be open to abuse by disingenuous parties.
Added later:
Aarrgh! Well I never claimed to be perfect.
In the spreadsheet I just noted that I have left the High Point value for 2025 (from a copy and rows insert operation). It should not be there, since we have not yet reached the ice formation high point for the year. That usually occurs in March. I will adjust next month.
For aesthetics, the zero values (February onwards) also should not be there. Their presence hints that they take part in the multi-year average – which they don’t. I will adjust that also.

Leave a comment