
As 2024 began, I noticed something which formed for me a vital image of the potential falsity of the whole climate catastrophe scenario once pushed on the world by nutty scientists and others of dubious referential integrity (in its more general, open meaning, suborned these days by computer geekdom [or geekery, if you prefer] to have been restricted to a more narrowly defined meaning) – politicians among them. I will explain that ‘vital image’ in a moment.
And so I have waited, patiently, observing the data as the year unfolded. Sometimes fearing I might be some way off the mark as the data meandered, sometimes in surprising ways from the path I had envisaged it might take. I need not have worried. All ended reasonably well – as I will show.
What I had proposed, contrary to my own earlier views, was that the half-baked global warming scenario being pushed and almost universally accepted these days (even by folk who should know better) is a total wacko scam of shambolic proportions.
This used to be – you don’t hear it so much these days – spearheaded, among other shrewdly misguiding indicators, by the situation of supposedly disappearing Arctic Sea Ice. To the extent that the bunch of nutty scientists I mentioned (they used to call themselves AMEG), attempted to advise world governments in 2012 that Arctic Sea Ice would entirely disappear by 2020. Or was it 2016? I don’t remember now. And it was true that, for two decades running (from 2001 to 2020), the Arctic Ocean lost around a million square kilometres of sea ice each decade. A cause of worry, no doubt. If it continued at that pace, and the one year rush (2012) to only a little above 3 million square kilometres of ice remaining at the end of that Summer, only added to that worry. But when you look attentively at the data you will see that nothing of the sort was ever going to happen. A boiling planet? It’s a joke. And a poor one at that. Yes, it has been a little bit warmer in recent decades, but not unusually so. Not extraordinarily so. And not as extremely so as during two other short-lived (as this one will be – and which probably now is ending) episodes of similar but slightly higher top temperatures than we see today. I speak of the Holsteinian and Eemian periods within the last 250 thousand years of Earth’s history. So, what I am trying to say is that we are experiencing nothing new within the planet’s boundaries of climate variance. More ancient human species than ourselves, who lived and existed during the past several million years (or perhaps much longer), put up with, or enjoyed, or struggled through (I guess we don’t know how they would have assessed their living conditions as being), without making anywhere near the fuss and panic of modern humans. Are we weaker than they were? Are we less capable? Are our living conditions worse than they had? Well, actually yes they are. But not in terms of temperature. The main difference being that we do not have anywhere near enough Carbon Dioxide in our atmosphere today, even though levels are growing slightly – but not fast enough. Meaning that our world is becoming barren with growing desert areas, less protective vegetation (forrest areas) and diminishing natural food production prospects. We are in fact killing ourselves through our efforts to change that in unnatural ways. Not least by our futile but thoughtless endeavours to bury CO2 away in schemes that if left unchecked will ensure the death of all life on the planet. Rest assured that the planet’s climate progress is self-correcting (which is the only reason for the recent turn-around in CO2 levels to be positive rather than negative) and will return to normal. We (humans) had nothing to do with that change. It began long before modern industrial society emerged. Although , to give ourselves some credit, we may have helped it along a bit in recent times – in totally unplanned ways and even without our knowledge until recent years. We are perhaps no smarter than ancient man was. We know more of course, or think we do, but we still blunder our way through life, making mistake after mistake and rarely perceiving the folly of our actions – which are generally guided by mischievous and unscrupulous individuals who care nothing for the folk they so easily deceive, hurt, and punish for being such dumb sheep so easily led by herd instinct to follow rules made not for their own benefit – which so often leads to the slaughterhouse when they have lived beyond their usefulness.
Sorry for that. I went a bit off track. But there is little there which could be argued against.
If the climate alarmist tale of catastrophe, human guilt and demands for unnecessary control, was true or contained even a modicum of truth, what would you expect to see? What would become obvious and unimpeachable?
Well, obviously, you might expect further and continuing falls, of perhaps even more than a million square kilometer loss of Arctic Sea Ice each succeeding decade (since the world is supposed to be getting uncomfortably hotter with every passing year). So, how is that going? Well, equally obviously, that is not the only observation to consider, but let’s look at the data. Is the sea ice (renewed annually over Winter) actually being destroyed, by anything? NO IT IS NOT (at least no longer). And that is an unequivocal statement. It cannot be denied. In fact there is marginally more ice being formed this decade (on average) than during the previous one and only a minute amount recorded as melting in excess of that previous decade average melt.
See this spreadsheet I have just put together at the end of the fourth year of the current decade. This is based on data from NOAA as used and displayed in the NSIDC Arctic Sea Ice Extent charts every day.
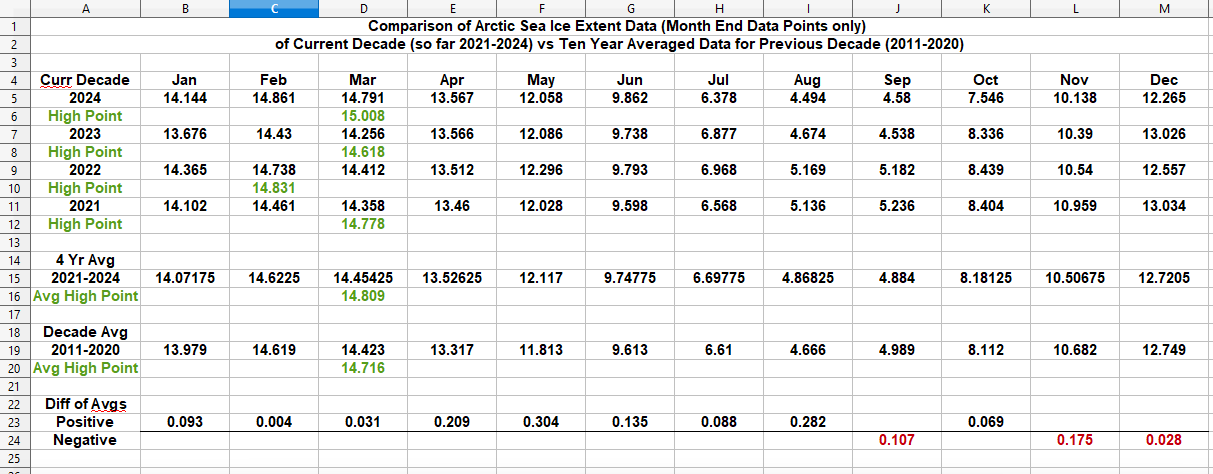
The first point to take from the spreadsheet image above, is that over the first four years (just completed) of the current decade, when averaged, for the first eight months of the year (remember this is 4 yrs averaged data – taken on the final day of each month [I don’t have time to spend calculating for every day of the year]), the current decade shows there was slightly more sea ice than at the same time during the previous decade. Only in 3 of the final 4 months of the averaged data for the period, was there slightly less ice than in the earlier decade. None of the variances each month could be considered excessive and more than two thirds of them erred on the positive side. That is exactly what I predicted at the beginning of 2024 for the current decade. I actually said something like, for the current decade, sea ice melt would either advance only slightly over the levels of the previous decade or there might even be a slight retardation of further sea ice loss.
The Arctic ice melt has been stopped dead in its tracks. And theoretically, based on the real background climate situation, sea ice melting will now begin to recede in favour of ever more ice being formed each year.
That was a pretty bold statement to make at the beginning of only the fourth year of a decade. It has I think been borne out to some extent by the results of the last year, 2024 (variable and wildly wandering as the data has been at times) when included in a progressive average for the decade so far.
Now I know this represents only 40% of the decade. But now we are in 2025, every further day’s recording of the sea ice position represents exactly half of the decade data body, and at the end of this year we will have a full 50% of the decade’s data to compare. Is there any reason to suspect that the second half of the current decade will be any different, or markedly different, to the first half? So, with expectancy, we move on. I will continue to observe and make comment as time passes as to where this is headed. And even if 2025 turns out to be a year with results negative to my suggestion, I will not abandon it until the direction of the whole decade has been revealed. I can do this only on the basis that, at some point, the current temporary warming period, which I repeat for the nth time has been ongoing for around 17 thousand years and must soon end (as all previous such events did – in about the same time period, which ends around now). Of course, it is difficult to be precise about that, but current data – as revealed only now day-by-day as history unfolds – is showing signs, quite clear signs, that the time for this is this decade. That is as close and precise as I, or anyone else with a similar theory, can be – until at least 2025 has ended – and ultimately until the decade ends at the end of 2030. Only then will we have some reasonable assurance that this is actually what is happening. I am prepared to wait, and see, if my fate is to live so long. Hey! It gives me purpose, in a world where such is in short supply.
One final point this time. The average high point of ice formation, recorded in the above image, is higher (if only slightly) this decade that that of the previous decade. Meaning that indicator of a turn from hotter years or decades to markedly colder centuries and millennia to come, is actually headed in the right direction – even if some individual years, like 2024, offer a net loss in sea ice from one end of the year to the other – being offset of course by a net gain in others. Incredibly, that gives me a warm feeling about what we may begin to see from here onward.
Correction: Since posting this originally, I noticed an error in my spreadsheet. The Difference of Averages for October was actually a positive value, not negative. I have changed the image and altered text slightly as appropriate.

Leave a comment