
Over the next two weeks the world is going to see more than 2 million square Kilometres of new Arctic sea ice form around the edges of the remaining ice covered waters of the Arctic Ocean. That is up to around half a million Km2 more than average in previous years.
How do I know this? Well, we have the data for the recent past and, if my theory that Arctic Sea Ice expansion has now stopped (to be precise I said “during this decade”, which still has 6 years to go), then there is a corollary to that (assuming not much total energy is lost from the system as a result of the change) on the basis that this can only be due to further cooling of the planet. The winter ice build-up should begin to strengthen. Meaning more ice being laid on the ocean surface over Winter, than melts during Summer. And since the time between seasons has not expanded, the speed of ice build-up (actually I prefer the term ‘formation’) must increase.
It is early days yet, which makes this prospect rather exciting (especially since no-one else, that I am aware of, has noticed this phenomenon, or at least is writing about it), but can we see anything so far that would lend any strength to the argument?
It is unfortunate but perhaps unavoidable, that the winter ice formation carries over across two separate years of NSIDC sea ice charts. So let’s split this observation into two parts. One covers the last months of the year, the other the first four months of the year. Neither of which, at this stage, will contain any data for the current formation cycle (it has only just begun). But of course they can show us what happened in the previous years of this and also past decades.
First lets take a look at recent decadal averages over the past 40 years to get an overview of events. [All images, I should point out, are snapshots from the NSIDC Charctic Interactive Sea Ice Graph, which you can also play with yourself.]
It can be seen that there is a much wider band of movement during Summer than there is over Winter. So we should not expect to see much movement in the level of Winter ice formation, at least at first, as ice formation progresses, rather than the current receding over time. We will focus only on what goes on between the black and blue decadal averages lines for the past two decades.
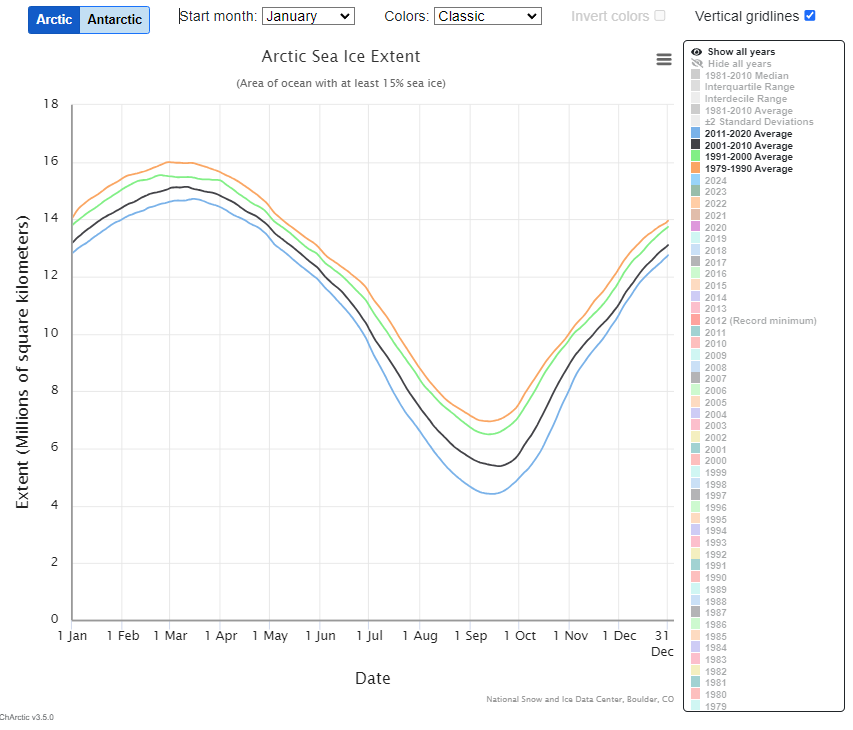
The black and blue average lines I mentioned, are shown in the next image, together with the annual data lines for 2021 to 2023. Not as yet having reached this stage, no data for 2024 is shown. While not much is going on below the blue average for 2011-2020, as the ice formation reached the end of the year, it is interesting to note that for two of the three years, 2021 ans 2023, ice formation almost exactly matched that of the 2001-2010 decade. For some reason, the orange line for 2022 (which after year end became the green line for 2023) shows a failure of build-up in the last week of the year to something less than average. This also illustrates how the vagaries of individual years do not allow us to make any real sense of matters as they happen, and why we rely on the longer term averages of ten year periods to be our guides.

Now let us look at the beginning of the year for the second part of ice formation.
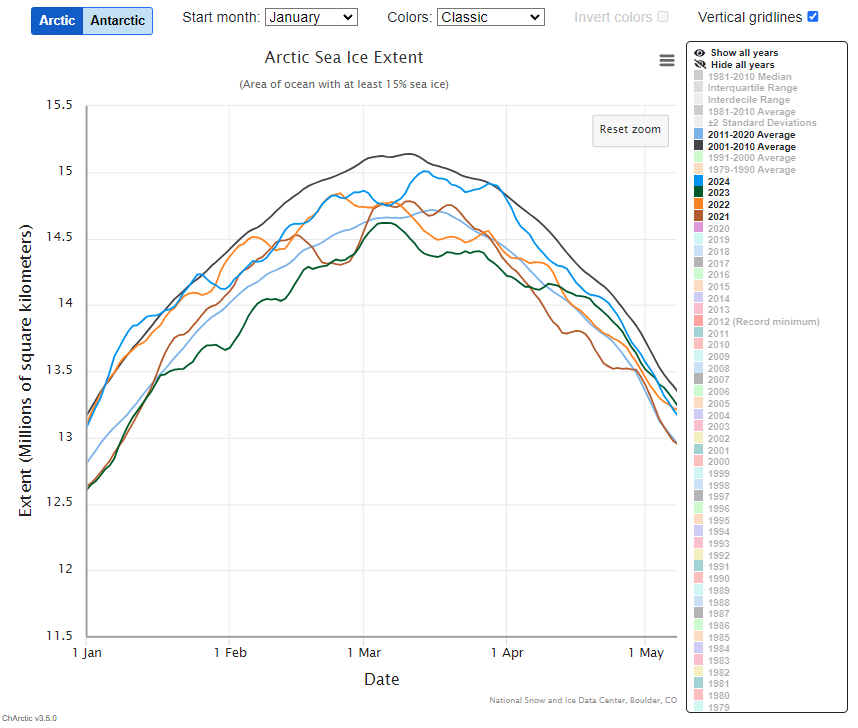
Here we can see, in addition to the black and blue decadal average lines, four annual data lines. The brighter blue line for 2024 is shown, as this is now past data (this represents the situation 11 months prior to the previous image). And here we have to do a little ‘Back to the Future’ mind-bending. The colours representing the annual data still align with the same years as in the previous image, but they have changed position as the year rolled over. For example, the orange line for 2022 in the previous image, has now become the green line for 2023.
Anyway, the main ‘takeaway’ from this, as I see it, is that most of the ice formation activity takes place between the two decadal averages lines, except for 2023 which continued the lower than average ice formation begun in the last week of 2022. But 2024, on the back of the high ice formation finish (close to the average of two decades earlier) of the 2023 effort, continued as an exceptionally high ice formation year. Whereas 2022, taking off from a similarly high finish of 2021, suffered an exceptionally early peak in the last week of February – the annual peak of ice formation normally taking place during March.
Overall, I would say that the available data shows higher ice formation levels than the previous decade average, reaching at times the level of two decades back. A situation as I would have expected to see. There is also very little, perhaps even nothing, to support the view that Arctic sea ice is in decline with both lower ice formation and increased melting – and that would be an absolute necessity for any climate crisis scenario.
While the case is not yet closed, it is at least pointing in the right direction. Here’s to being able to make an even stronger statement near the end of 2025.
I will close with a simple answer to a complex question. Why do I focus on the Arctic ice situation, ignoring Antarctic conditions? Because that would be like comparing apples and oranges.
There is no danger to Antarctic ice, until GMST rises another 6 to 8 degrees – which will not happen any time soon, perhaps never. And I believe I have shown there is also no danger to Arctic ice conditions, though there is a higher vulnerability there. So stop worrying. I may expand on this later.

Leave a comment