
First a few facts about what happens to the sea ice during late Summer.
July of each year always sees the heaviest loss of ice for the year. Over the satellite recording period this has averaged at around 2.6 million Km2 for the month. Over the previous decade, 2011-2020, the average loss was almost exactly 3.0 million Km2. Over the last few years of the current decade that figure has been around 2.8 million Km2, with 2021 being just a little under the previous 3 million average. With the reservations I expressed in a recent post, this indicates a slight fall in July ice melt so far this decade.
The ice melt for August has always been around two thirds of the July melt. That is around 2 million Km2. Although August is a much more volatile Summer month than either June or July. I haven’t included June in this analysis because there was nothing extraordinary about that month – there rarely is.
As for September, well that month is always, always, always, a net ice gain month. Without fail, more ice built than lost. And the losses are usually well below half a million.
So, what does this tell us? Well, if the rate of loss slows during August, there must be a point where this becomes visible in the data. Note, I am using the most powerful computer to help me make that statement – my Mark 1 Eyeball. Ok, OK, it’s a 79 year old Mark 1 Eyeball but good enough to see this change. And the most interesting thing about the slope change presented in the NSIDC graphs, thanks to the averages provided by NSIDC, is that over time, more than 4 decades now, the point where the slope changes is becoming earlier as time goes by. What does that mean? Well first let me show you how things stand now. You can go to the NSIDC website and see for yourself. They have provided an average line for each of the four previous decades for which there are data. You can select any area of the chart you like with your mouse, and describe a rectangle, which on release will produce an enlarged view of the selected area, for easier viewing.
Look at the average line for 2011-2020. I would say that the slope alters about the beginning of the final week of July.
Look at the average line for 2001-2010. This is not so easy, but I would say that the slope alters perhaps about the same time – the beginning of the final week of July, or perhaps between the first and second week of August.
Look at the average line for 1991-2000. I would say that the slope alters a few days into August.
Look at the average line for 1979-1990. Again it is difficult, but I would say there are several points, all well into August.
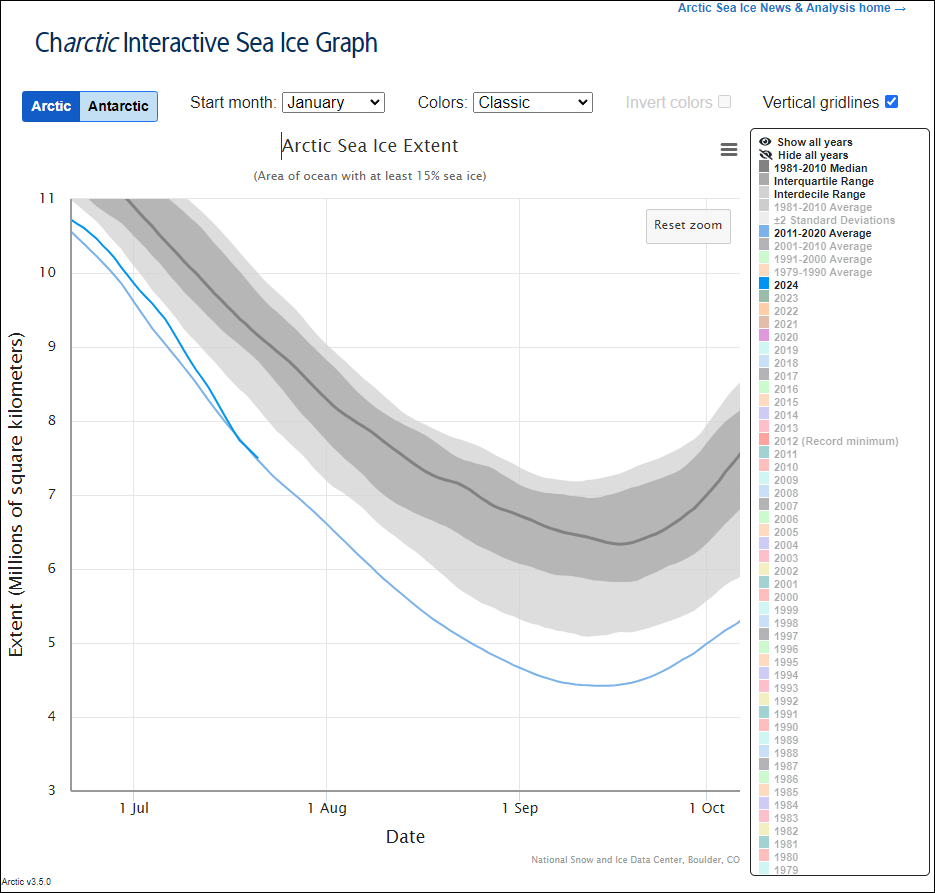
Now look at the blue line (image right) for the current year, which briefly – and for the first time this year – crossed the previous decade average line on July 18 and has immediately returned to above that line. Consider the question, is this sudden switch a new boundary mark for the slope change which delineates the July-August change of speed of the ice melt?
Yes, I know this is all a bit intuitive, and a few more days readings may throw some/all I have said here out the window. But it could also be correct.
If my declaration, now made several times, that we have reached the pinnacle of temporary and superficial global warming, within a more generalised long term cooling of the planet (which is the position most scientists – of relevant disciplines – also hold), has any validity, is this not something we should be expecting to see?
Let me explain that a little further. In the earliest 2 decades discussed, as Summer heat was still increasing, the end of Summer drop off of sea ice melt would be expected to occur later, as it did, or appears to do over decadal averages, at around mid-August. As time moved on and the effect of Summer heat began to wane (and we would expect to see some anomalous outlier years over that period – as we did, e.g. 2007, 2012, 2020 [a last hurrah?] – but not 2023, which was a rather ordinary year, despite all the hullabaloo), we would also expect that boundary slope change to gradually move forward into July. Would we not?
Again, at this stage, this is speculative. But remember, if it happens, you heard it here first (as far as I know).
Oh, I apologise. This turned out to be not so brief after all.
There is just one more point I want to make. 2024 entered July with 9.862 million Km2 of Arctic sea ice (according to NSIDC). Would it not be a great confirmation of all I have said, if the year entered August somewhere near 7 million Km2 of remaining ice, which would represent just 2.862 million Km2 of ice loss for the month. No question mark, that’s a simple statement.

Leave a comment