
We are now at the mid-point of 2024. What do we see?
Well, just to set the scene and declare all my cards, a few days into the year I made the prediction that the decade by decade period of annually increasing Arctic sea ice melting has now reached its maximum level during the 2011-2020 decade which ended 3½ years ago now.
If my prediction is correct, what should we now start to see?
Well, possibly two things. The current decade, 2021-2030 (and I am using these boundaries because that is what the NSIDC has for 4 decades now used to delineate its own statistics) will reveal that the level of sea ice cover (the extent) over the Arctic region will either remain at more or less the same level as the previous one or the trend line of ice coverage will be higher (meaning there will be more, not less, Arctic sea ice, on average, year round) than that of the last earlier decade). Moreover, that decadal evidence of increase in Arctic sea ice levels will continue to grow, from this point onwards and probably for at least the next 100 thousand years until a next projected minor heating-cooling cycle kicks in, if it in fact does. Anything could, and probably will, happen during the next 100,000 years. Not that that will concern us alive today, nor should it. Each to his own period of history.
The Northern Sea Route, so recently opened for several months of the year, will become permanently closed once again (except perhaps to Russian ice breaker vessels, although I wouldn’t guarantee even their efficacy to oppose that for any meaningful levels of trade, too far into the future). As far as we know, there has never been a northern sea route open to maritime trade since the ice sheets formed up to some 10 million years ago (Arctic) and up to around 40 million years ago (Antarctic). And we have no idea what sea routes were available earlier than those times – though there were no humans that we can verify, alive at the time to use them – as all the continental land masses have repositioned themselves over that period. The times we are living in, dear readers, are quite unique to ourselves and never before experienced by even our most ancient or relatively recent predecessors.
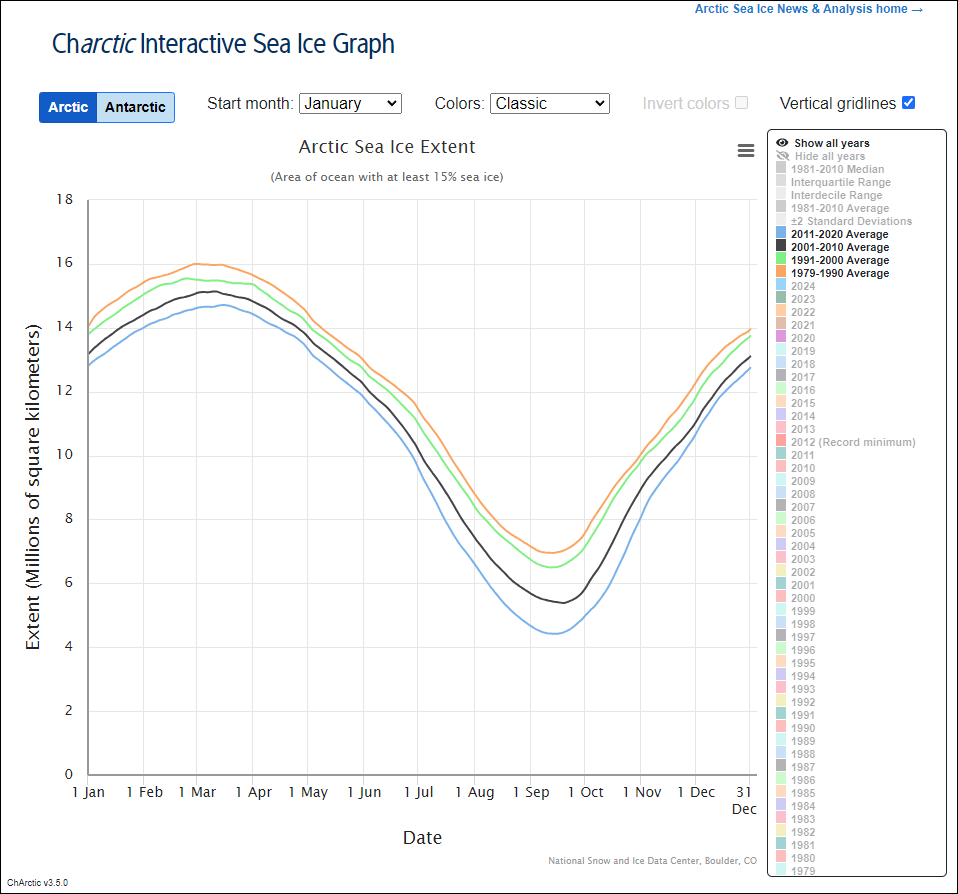
To set the scene, here, in the chart below (and you can reproduce this chart and many other variations for yourself online at the NSIDC Charctic Interactive Sea Ice Graph) are depicted the decadal trend lines for all 4 decades since satellite recording began in 1979. It doesn’t require some level of genius to see the decline in sea ice levels over that period. (click on chart to expand)
None of these trend lines should be considered to be ‘normal’ and as the Northern Ice Sheets formed from around 10 down to about 6 million years ago, the sea ice would have also grown. That process being modulated somewhat after the warm Atlantic Gulf Stream was created some 3 million years before our time. But there was a lot of multi-year ice present atop the Arctic Ocean before and during the first two decades of modern satellite readings, and not much change in ice levels over those initial years – though a mild decline had already been set in motion. It was only during the two most recent decades (following the turn of the century) that an alarming amount of sea ice loss has been observed. This of course triggered the current state of confusion around climate change and fooled a great many people including some scientists, and myself. But it was all quite natural – nothing to do with us, as I have now realised and clearly see that we are coming to the end of the great 21st Century ice melt period. For the rest of this century and for many thousands of year beyond that, the ice at both poles will be growing and in fact spreading much further. But the world’s average surface temperature will never, I hope, fall much below the hundreds of millions of years normal standard low of around 10°C. Our current temperature trend line stands at a little less than 12°C and that has not altered more than a couple of degrees either way, as a low point (I like to think of it as the bottom of our operating envelope – the top being around 30°C, which has also never been exceeded), throughout the whole of human history (at least that of modern man).
But, enough projection, let’s take a look at some of the facts.
Looking at the above chart, from the legend it can be seen that the blue line represents the position at the end of the most recent complete decade. The Winter ice build-up, which occurs mostly in March, has fallen, over that 40 year period, from around 16 million Km2 to 14.7 Km2. About 1.3 million Km2 in total, a fall of around 8% of total Arctic sea ice and only a small fraction of 1% of the gigantic Greenland Ice Sheet. I mention that just in case you had fallen for the ruse that the ice is disappearing. While at the Summer peak melt, in September each year, the remaining sea ice has fallen from 7 million Km2 to 4.4 million Km2. Or around 2.6 million Km2 (which represents just another 8% of sea ice – not 16% as might be thought). That does represent an overall fall of 16% sea ice over the past 4 decades of course, but it is not like catastrophic. And there is good news to come. Can we deduce anything from that, about temperature I mean, or even attribute a cause? I think not, other than that this is an expected continuation of the gradual (although in geological terms, very rapid) increase in the Earth’s mean surface temperature of some 5-6°C over the past 17 millennia since modern man began to appear. This brief period of heating (which is against trend, but frequently recurring – in geological terms) which has no effect on the more powerful long term cooling trend of Global Mean Surface Temperature, has about reached its peak for this cycle and will from now on begin to show up as falling temperatures, back to the same low level as it began, and gradually resulting in more ice growth and less ice loss.
Read that last, underlined sentence again…
…because this is why I have been able to predict no further increase in sea ice melt from now on.
The cause of all the Climate Catastrophe milieu which has placed a stranglehold on humanity in recent years, boils down to simply misinterpreting this cyclical phenomena by unscrupulous persons. Not scientists, well, some of them might be (there may be rotten apples in every barrel of good ones). But mostly, I would say, drawn from those who make fortunes from finding opportunities for personal gain while possessing little in the way of public conscience.
So, what can we actually see?
When I made my prediction, six months ago now, I said that the current decade was most likely to reveal a halt to the ice loss but not necessarily much of a lifting of the trend line until perhaps the end of the 2030s. Ok, come September of this year we will still only be at the low point (Summer melt) of the 4th year of the decade and we won’t know the actual result for this whole decade until early 2031 – when the next trend line is drawn. But can we see any cause for hope in the data we have already accumulated? I say, yes.
What about the early years of the decade? Well, I’m going to show each of those years in separate charts because it is not easy to compare them when viewed together. But taken together they do give us a distinct impression that something has changed in the 2020s. See if you agree.
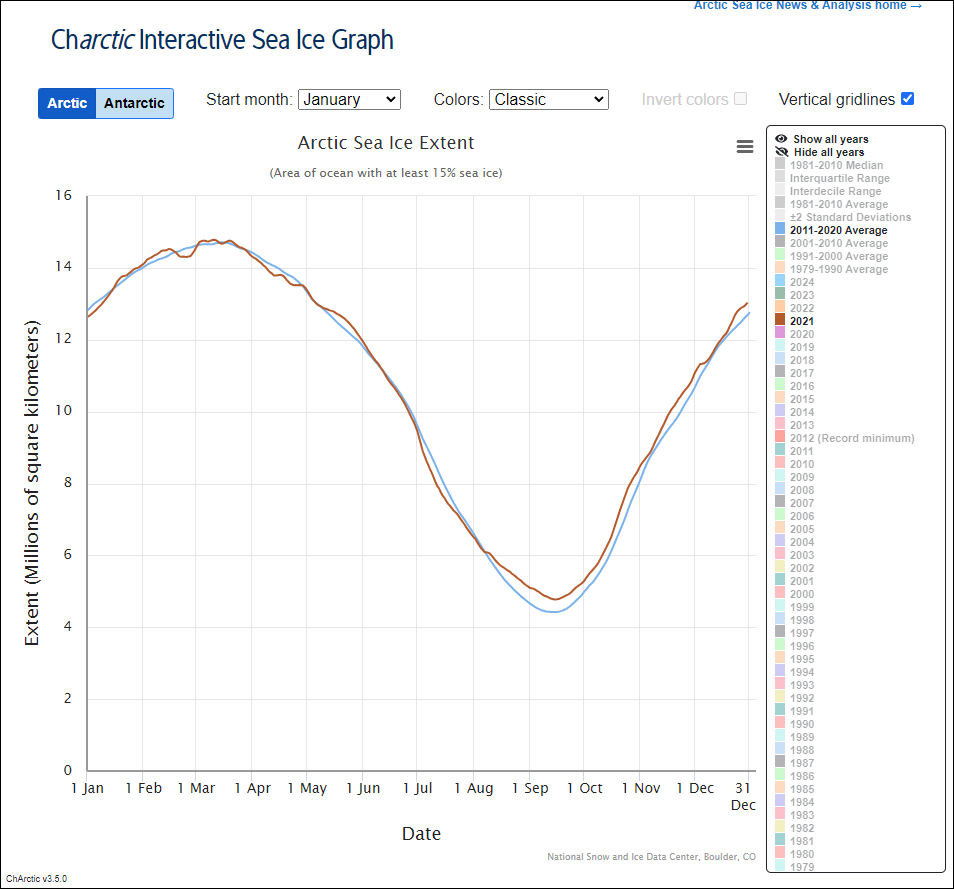
Beginning with 2021, the first year of the new decade, and following a particularly high ice-melt year (2020, with less than 4 million Km2 sea ice remaining at Summer peak), 2021 struggled to make even an average ice buld up over the winter months. But the remainder of the year, especially over the summer melt season, was spent above, at times well above, the previous decade average. That is a good start.
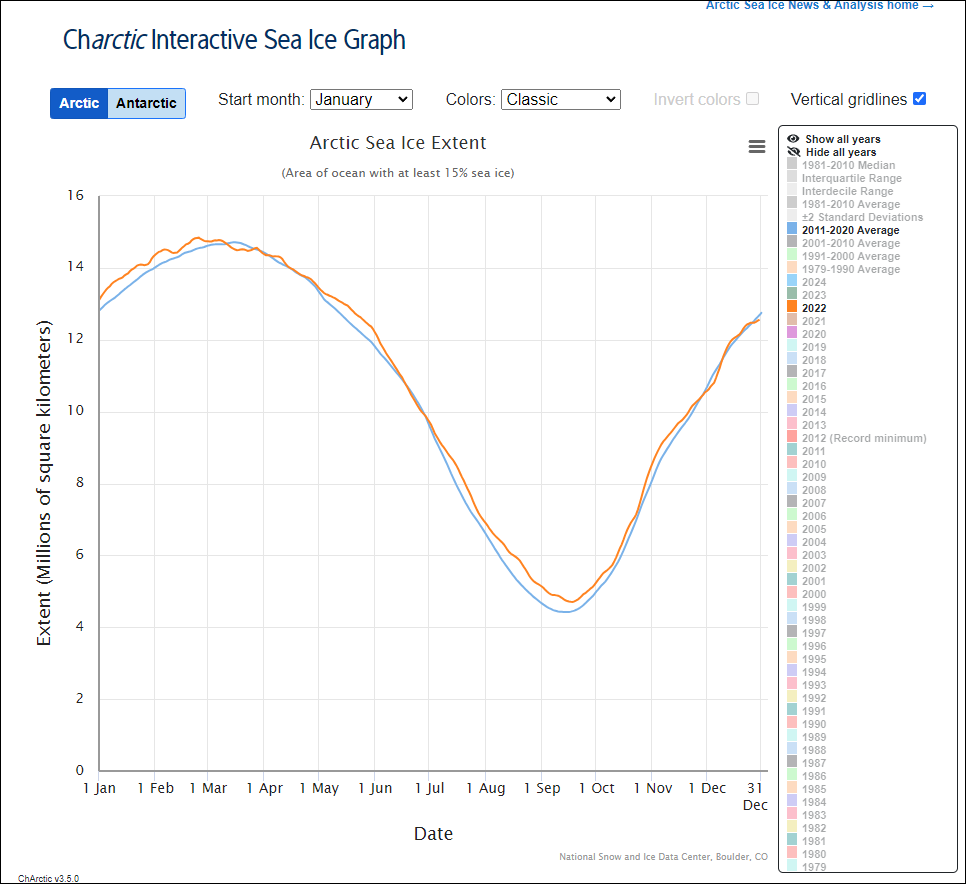
What about 2022? After the previous year’s low melt result, leaving an increased amount of ice remaining, ice build peaked unusually early in fact probably for the first time, during the last week of February and for almost the entire year the data plots were above the previous decade average. That represents two years now, plus the current year, so far, which strengthen my conviction that the increasing ice melt trend of previous decades is or has ended. What will the final complete year of records tell us?
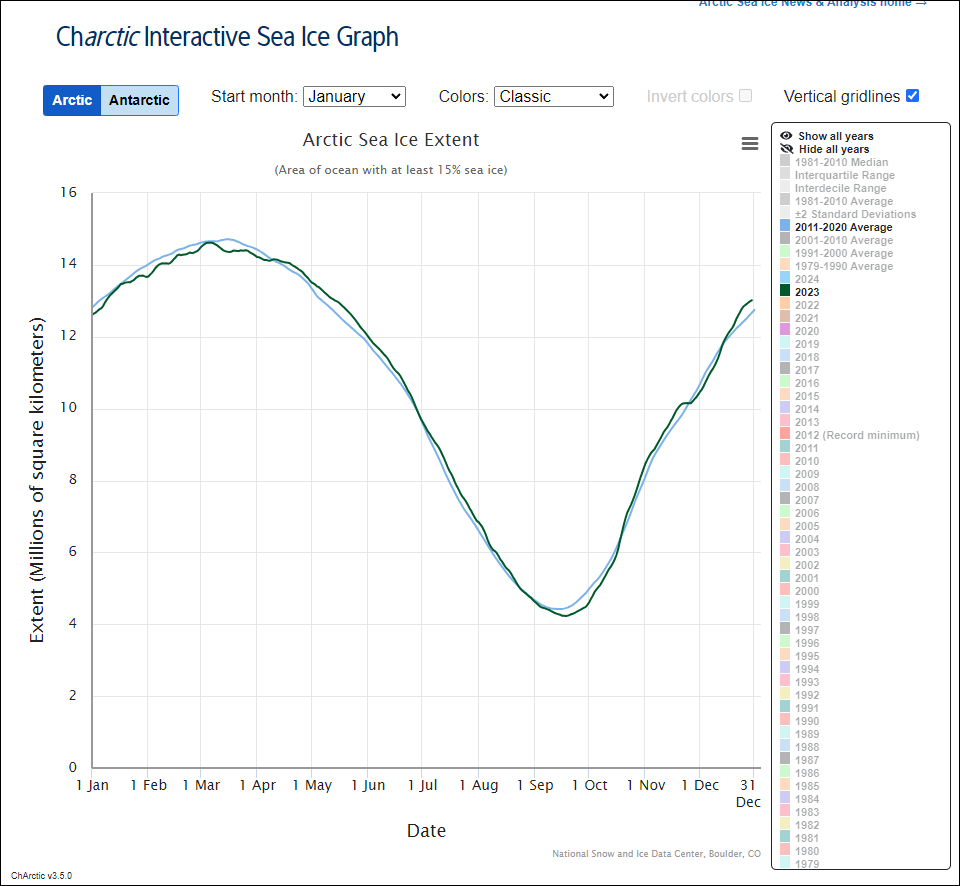
Now 2023, which many falsely claimed as being the hottest year on record, as or even before it ended. With boiling oceans even being mentioned by more than just the most rabid media. This was obviously untrue, on both counts. Well, the year did begin with a lower than average ice build season (see left) but the remainder of the year, apart from a few weeks in late summer was spent as a particularly average or above average one for retained ice coverage. And in those hot, final days of summer, the additional ice melt, which was beyond the previous decade trend line, was not really worthy of more than passing comment or note. It is difficult to come to any conclusion other than to say that year was anything but an overall average one, as compared with the previous decade.
And now to 2024

So, half way through the year, and with nothing much to write home about in the previous three years, how is 2024 shaping up? Not once in the entire 6 months so far has the Arctic sea ice coverage fallen below the previous decade average. See chart at right. And I don’t see any signs that this is going to be an excessive melt year across the summer season. Time will tell of course, but I am emboldened, by all that has been recorded above, to make this prediction.
Now, with (if it so happens) 40% of the decade passing with more or less average years of activity in Arctic waters, with no obvious further receding of ice coverage, can it not be said that the 21st Century main prop for disastrous climate change has been relegated to the scrap heap of time? This actually represents, I believe, a turning point for sea ice in the Arctic Region. From now on, the sea ice will begin to expand rather than recede. I expect that to be not very visible until the following decade, but it will certainly get no worse. On the subject of ‘worse’, just how badly do you think our planet is suffering right now? Well, it would require a lot of space and time to go into just how bad things have deteriorated for Mama Gaia over the past 10 million years or more. She is struggling to keep us all (and I mean all living things on the planet) alive and in any kind of good condition. Well meaning but really dumb folks I suppose (I was one of them once), have somehow worked out that ‘we’, that is ‘humanity’, are to blame. The real answer is nothing of the sort and we kid ourselves if we believe that anything we do could so affect the planetary systems around us that it would cause the planet any worries or difficulties. We can only mess up our own local livelihoods, and if we moved on to somewhere else, the area we left in ruin would soon recover itself and become productive again. Take for example Hiroshima region. Devastated only 80 years ago and now once again a thriving city. Don’t be fooled, the problems we see are nothing to do with us. I could go on but back now to today’s subject.
There will, or may be, before decade’s end, one (unlikely more than that), annual melt season which could try to overturn my prediction, but even that would not actually invalidate the conclusion, I believe, in any way. We (I say we, but in fact it is nothing to do with ‘us’, which means I am referring to planetary systems) are on our way now to reversing, over the next several millions of years or so, the cooling trend of planet Earth’s climate to a full planetary recovery of all forms of life. Noting that there is absolutely no connection between that prospect and our current, but momentary (in geological terms), heating and cooling cycle. Noting also that this has nothing to do with our, that is humanity’s, burning of fossil fuels nor the marginally increased emissions of CO2 – which represent no change to the composition of the air we breathe. As if all our combined efforts in any noteworthy direction could pose any risk to planetary scale operations.
The Future
The Arctic sea ice is the only major climate element which needs to be observed. Not the Greenland Ice Sheet nor any ice in the southern ocean. All are now safe, for millions of years to come. Yes, at some point (it may take another thousand years or more to complete the turn) the global temperature trend will begin to gradually rise above the current range of 12°C ± 3°C. It needs to do that, and it has been there many times before we were here. And CO2 needs to continue to rise – which doesn’t always occur with rising temperatures – to obtain at least two or three times as much atmospheric CO2 as currently exists. Which condition has also been there many times before we were here.
Climate catastrophists, the planet is showing the absolute folly of your weird daydreams. We just have to wait for it all to play out now, to show that there was always nothing to it. In fact the now naturally increasing levels of CO2 have saved the world. And we played a part, if only a very small one, in bringing that about. Our future generations, if we don’t destroy our chances by other means in the meantime, will reap the benefits of our having lived through the worst dearth of the natural agent of growth for all living things – Carbon Dioxide – in our planet’s history.

Leave a comment