
Limited Vision of Man
OK, it’s time for me to be blunt again in the ongoing battle to dispel all rumours of any kind of ‘climate emergency’ going on in our neck of the universal woods. There is no ‘climate emergency’, no ‘uncharted territory’ of any kind. What we are witnessing is normal, I repeat, NORMAL, and oh so slow cyclic factors at play in the field of climate change. It is what climate always does, only it does it so slowly that any minor bumps in the road appear to be outrageous abnormalities. And there are always bumps in the road with all natural systems. But bumps in the road are purely temporary features which, over time, will even themselves out. And that is the way they should be viewed. The main problem with this is that we humans – who have such short lives and such excitable natures – can only ever witness minute portions of the passing of time. And, in our limited view of the world, such minor deviations are blown out of all proportion to their actual value or significance. They actually have no real value or significance.
I can hardly believe that I am going to use a CNN article as a reference point here, but this one actually contains a lot of truth, carefully hidden. And it is that truth which belies the headline of the CNN piece. That headline being pure fiction.
“Global heat in ‘uncharted territory’ as scientists warn 2023 could be the hottest year on record” says CNN, who not too many years ago were leaders in the climate change denial business. How times change. Now they are leading the charge in the other direction. Why? CNN hasn’t changed. The climate hasn’t done an about turn. The prevailing science story has not changed, much. The climate skeptics are still skeptical. The climate catastrophists are mostly still forecasting doom. I appear to be an exception to that just now. I don’t have to believe in climate change. I know climate change is real. It always has been and will always (within bounds) continue to be. It may or may not be catastrophic for humans in the future. There are no guarantees and no way to avoid extremes if they do occur, either way. But I maintain that there is no current cause for concern. So I have changed – but that doesn’t really matter. It matters to me but not necessarily to anyone else. I am a little older and perhaps a little wiser. I can stand aside from all the clamouring rhetoric ands see things as they really are. Or at least as what the data science so rigourously and continuously collects, shows them to be. It is a matter of interpretation, and also the application of both logic and some common sense. It is not that difficult, given the will, the data, and an open mind.
So what, of any significance, has more broadly changed?
It is the monied elites, once supporting the skeptics in order to preserve their now failing 20th century empires, who now have a different message to offer. You know where this almost identical but newly nuanced and heavily financed and propagated message is coming from. The global elite who control, or seek to control, everything through governmental forces at both national and international level and through the manipulation of industry, agriculture and finance. They, representing only themselves and without any real belief in looming climate mayhem, have changed sides in order to present that message. And that is as a direct result, not of an awakening among the population or the journalistic community, but in the minds of those who can see a prosperous future for themselves and a means of further harming and impoverishing the general community while they both reap rewards from exploiting a mythical catastrophe for all it is worth and at the same time pursuing their goals of complete control and manipulation of the global community of man. And that is an easy task with a population already convinced that something dreadful is happening.
It is only when we come to realise that it is elements of mankind itself that is driving the current alarmist furore around a largely fictitious emergency scenario, rather than actual and observable physical occurrences in nature (compared to what has been in the past) , that we will be able to understand what those natural movements in Earth’s climate are doing. And understanding brings assurance, one way or another, that it is not ‘we’ who are to blame for that (as our natural hedonistic arrogance has been tricked into believing), but that it is simply nature at work, doing business as usual.
Of course we also need to understand that whether through heat, cold, or many other possibly fatal contingencies always seeking to destroy us, the long-term natural state of planetary conditions is not and is never likely to be conducive to our continued existence here. This is said to be our home planet, but it is a planet we are signally not designed/evolved to live on without considerable aid – including around 20 years of parental care and guidance before being ready to face the world in our own right. Such sustaining effort and lifelong watchfulness being required by no other animal co-inhabitant of this planet but ourselves. Do we have the right – we certainly do not have the means – to even attempt to alter the planet’s natural state to be something more accommodating for ourselves? I would say not. It is only that same hedonistic arrogance we seem to have been imbued with or have ourselves nurtured into existence, which would consider our own personal survival, if it were to come down to that, to be more important than any other consideration as to the real existential value of our lives.
Back To The Future
The future is always unknown. The present is fleeting and unstable – not yet enjoying the stability of the past. So it is to the past to which we must turn for guidance of expectations as to what lies ahead.
So, now, finally I get around to saying what drove me to begin this piece. And I simply want to point out two things. For any other related point I would refer you to my other recent articles on the so-called climate emergency. This present writing only adds to those prior works.
First we go to the Arctic and then to the Antarctic. These two polar regions are the miner’s canary-in-the-cage litmus test for climate change. In the central, equatorial or tropical parts of the world, nothing changes much. And this is important to know as we look at the climate picture. All large-scale changes occur first at the poles. No other conditions of similar proportionate risk apply, unless it is something on the scale of fresh movements of continental land masses around the globe or the discovery of massive planetoids on a collision course with our world. And I don’t think either of those has so far been seriously mooted as being imminent.
I have had much to say about Arctic sea ice and northern ice sheets in the past, most of which was based around perceived and increasingly rapid melting of sea ice and the discoveries of meltwater on and under the Greenland ice sheet – the only remaining major northern hemisphere ice mass into recent times. And it was this as much as the accompanying melt of permafrost with its consequent risk of massive release of methane, which drove the current catastrophic climate change furore, which has now developed into tales of ‘boiling oceans’ and deadly continental heat waves. But how much of that is true reporting, given our current position in the natural cycles of climate movement? Or are we only concerned that our tenuous claim for the continued existence of modern man may be at risk here. My claim is that we are not actually facing such risk, and if it should be realised that we are at some point facing conditions which threaten our future, so what? As clever as we think we are, there is absolutely nothing we can do about that, just as we do not possess the capability to be doing or have done in the past, anything to bring that condition about by our own activity on or under the planet’s surface. At most, all recent human activity has only around a 1% effect on the global climate. I maintain that almost every (99%) of perceived change to the climate that we have seen in the modern age, is actually normal and of natural origin. There is no mea culpa here. Yes, we should be taking better care of our planetary home, but history tells us that it has survived, and only thrives today, as a result of far greater perturbances or perturbations (simply a question of degree of severity) in climatic activity than we are capable of comprehending. So, where do the lurid stories of catastrophic climate change come from? The science is good. The science is based on good data. The science does not declare any such dire warnings as we are continually hearing. It is in the summarised reporting of scientific data that opportunities for mischief and misleading stories are made. And man, have those opportunities for mischief been worked hard by unscrupulous persons, organisations and entities purely for their own reasons and benefit.
It is only in the most recent of geological times that our planet has known ice formations in northern regions. Northern hemisphere ice sheets, which were very more extensively located in earlier times than is currently the case, were formed only some 6 to 15 or at most 20 million years in the past (a mere blip on Earth’s history). We would have to go back at least 150 million years and possibly 270 million years to see any ice-sheet in our northern polar region (and who is to say what, if any, land mass resided there at the time – or where the polar regions were actually situated on our planetary mantle at the time).
I discussed the reasons for the most recent of formations of northern ice-sheets in a previous article. Damn it, I’m going to show again here the associated image I used previously, because it is important for a proper understanding. And without a proper understanding – which you will never get from perusing scientific journals – where are we? So, take a look at this graph of Global Average Temperatures over the past 65 million years – which contains no statistical sleight of hand, distortion or disinformation – but does provide (almost) everything we need to know to gauge where we stand now, climate-wise.
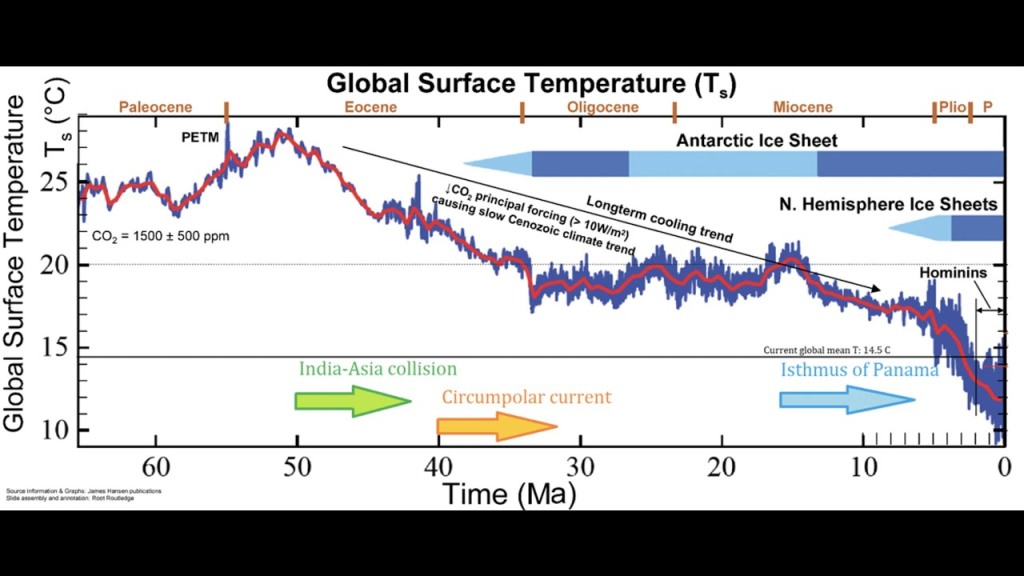
Stated in that image, and going back in time to the end of the dinosaurs (just off the chart to the left, occuring 66 million years ago), Carbon Dioxide concentrations were some 2-4 times higher than they are now – even with our so-called recently elevated levels. That is also confirmed in this image, which I will not show here as it is a tragedy of statistical manipulation and projected fiction, which I only use to confirm that CO2 levels in the distant past have been much higher than we are so unnecessarily worried about today. In fact those very high CO2 levels can be associated with the very gradual cooling of the planet (That is a somewhat controversial statement but I will explain the reasons for it in the later section titled ‘The Earth is Cooling Not Warming’) which began at the same time as the dinosaurs left us and has not ceased to continue falling even to this present day – except for a few million years following the PETM – the next cosmic event in a string of Earth perturbances which resumed and continued our planet’s slide into the bottom end of its envelope of possible climate extremes.
We are perhaps dangerously near to that bottoming out today. Take a good look at the red, mean values line in the above GST image to really see what the past is clearly telling us. What we should be perhaps most concerned about today is whether the planet will break out of the bottom of its normal envelope of climate extremes in the near future, and will we see a return to the frozen, totally ice-bound world of the Proterozoic or earlier, largely not clearly known, epochs of a billion or more years ago?
By way of explanation for those previous sentences, allow me to point out that for the whole of the planet’s history – or at least back to 500 million years ago (I don’t care to go back any further, the thought of frozen or boiling planets does not amuse me at all) – the Earth has never seen Global Average Temperatures greater than around 33-34°C or lower than 9-10°C. Bear in mind that these are averages but as far as we know, the variations from average have generally been by only 1 or 2 degrees – until recently that is. Over the past million years or so, we have seen variances as high as 3 to 4 degrees from the continuously falling average – giving us no reason to think that any of this change is attributable to mankind. I will speak more on possible reasons for that perturbation later. At no point in that half billion years timeframe has the planet known overall freezing temperatures. Nor temperatures so high as to be inadmissible to mammalian or plant life – though periods where both have struggled. Furthermore, in the last 60 million years or so of mostly continuous cooling, the Earth has settled into a shallower range of global average temperatures peaking at around 18-20°C (or even 15-16°C over the last several million years) and down to the same base level of 9-10°C. A much more favourable ambiance (I thought I would use the alternative spelling for ‘ambience’ here – it just seems the better fit) for the development of the modern human than in earlier times. I am coming to a preference for naming this latest phenomenon as the planet’s safe ‘operating envelope’ for temperature. We should cherish it for what it is – even its extreme levels, which can get to being uncomfortably warm (think the levels of heat the world seems so afraid of reaching just now – which we may need to get used to for a while or avoid by moving elsewhere on the planet if possible) and also very uncomfortably cold (think what we call ‘ice-age’ cold) in various parts of the world. That cyclical variation occuring across a complete period of some 130,000 years – with the human friendly ‘warm’ period (which we now enjoy) lasting less than 10,000 of those years. We are at, or approaching, the peak of one of those cycles. Be grateful. It could, and will be, much worse, but it will get better again – on the long way down to the other extreme. This is the main point of my discussion here.
As a further aside, I am wearied by writing ‘global average temperatures’. So much so that I looked for an abbreviation for the term. There is none. I now realise that I should have been using the term ‘Global Surface Temperature’ (GST). But since the acronym ‘GST’ causes shudders down my spine, I will from now on use the more accurate ‘Global Mean Surface Temperature’ (GMST). Ah, that feels better already.
What Does The Northern Polar Region Tell Us?

For more than 40 years now we have had the privilege of recording global temperature and other climate data by man-made satellite surveillance in addition to oceanic buoys and other weather applications of human ingenuity. Over that time of detailed observation it has become known that slightly less ice is being formed over the northern winter ice build-up period and increasingly more ice is being melted leading up to the summer peak melting period during September. That increase in melted ice is not regular of course, due to varying weather systems, but when averaged over 10 year periods there has been an obvious trend (see decadal average trend in image at right – from an interactive NSIDC chart) – at least since satellite records have been available. And that is the problem, or at least it has become a major part of argument for disastrous climate change. The argument swings mainly around the causes for the increased melt and the potential repercussions in a relatively near future. In 2030, the end of the next decade, what will the trending picture be? I have every reason to believe, from what I said in my most recent writings on the subject, together with current evidence, that we have already reached or are close to reaching the peak of current global warming, and that the next decadal Arctic Sea Ice average ice coverage will be seen to be close to or even a little higher than that of the 2011-2020 decade (shown as a blue line in the chart above).

Here, in the chart at right, we see the results of the first three years of the current decade with summer ice melt compared with the average for the 2011-2020 decade. That, to me, looks like at least a plateauing of the ice melting feature. Of course we have to wait another seven years for the full result, but if the current year – said to possibly be the hottest on record (in recent times) – can only produce a pretty average year (compared to the previous decade) with just a few weeks of slightly greater melting than average, occurring late in the season and now scurrying to get back to being average again, then that in itself adds to the argument I am making here.
Now to the Antarctic
The Antarctic ice-sheet is the biggest and oldest one on the planet, although still only formed in the last 40 million years following the resumption of planetary cooling after the PETM – Paleocene-Eocene thermal maximum (marked in the first chart). This ice-sheet is so big that the weight of ice pressing down on the land of Antarctica is sufficient to depress that huge land mass by around 1 kilometre into the Earth’s mantle. But you can read about this and many other interesting things about Antarctica elsewhere. What is it that we are concerned about here?
There has been a lot of unnecessary talk about Antarctic sea ice loss recently. Unnecessary because sea ice melt does not effect sea level (since it is already floating on the sea). Much of West Antarctica is actually sea ice and if most of that ice melted it would not greatly effect our oceans. The much larger East Antarctica ice-sheet is actually growing enough to compensate for any sea ice melt and is in some places now up to 4 Km thick.
You can read some of that current chatter in the following article. I was intending to offer some commentary on what is claimed there but I can’t now be bothered with that. If you read it in the light of what I have said here, you will see what nonsense we are being told.
‘Antarctic winter sea ice hits record low, sparking climate worries from scientists’ – ABC News Australia – September 26, 2023
If we then add to what I have already said, the fact that polar ice sheets cannot melt (other than by external influence and minor fringe conditions such as warmer surrounding waters) at GMST levels less than 21-23°C, we need have no fear of any impending serious melting of our remaining ice sheets. Our current GMST level is somewhere between 14-15°C, depending on the source, and is unlikely to go any higher than 16°C. On only one major occasion in the past 65 million years have we passed critical 21-23°C GMST mark – and that was on the way down in our long term, almost continuous, cooling event. And it was at that point, some 40 million years ago that the southern polar Antarctic ice sheet began to form. We are in no danger of losing our south polar ice. There was one other brief period around 15 million years ago at the end of the stabilised Oligocene-Miocene period where for some 2 million years we rose to just above the critical 21°C level before resuming the cooling trend again. It was following that slight bump, and other more geo-centric factors that the northern polar ice sheets began to form (like it needed another kick-start of sorts to get that going). All of those northern ice sheets except the covering of Greenland have since disappeared – not because of any natural climatic heating event but due to external factors of a more cosmic variety. Neither of our two remaining great ice sheets are at any risk, due to the continued planetary slide into cooler conditions. Nothing more needs to be said on that.
The Planet Is Cooling, Not Warming

The main cause given for current global warming is the recent i.e. over the past 150 years or so, increase in concentration of CO2 in the atmosphere. It is becoming fashionable to lay the blame for that rise in CO2 squarely at the feet of humanity, That is, the wording increasingly being used indicates that we are responsible not just for part of that rise – which itself is questionable, and we should not readily accept that indictment – but that the whole problem is ours. This is an absurdity to say the least. While CO2 is part of the natural cyclic action of all the planet’s gases, carbon dioxide has historically been in much greater proportions in the atmosphere than we see at present – many times greater – and frequently not in a heating context but associated with planetary cooling. How could that be? Read on a little further. CO2 is not our enemy. It is our friend. And we are not the enemy of the world in which we live – although we may become that if the ‘fight’ against climate change results in gross acts of environmental sabotage in pursuit of profit as some have proposed being a ‘cure’. The climate is not ‘ill’. It does not need a cure. The planet does not need to be ‘fought’. Everything is normal, and proceeding as it should. So, if we are not the problem and we still wish to believe there is a problem – which there may well be (but it is not CO2 and not us) – shouldn’t we be trying to ascertain what that problem actually is?
If you are not convinced that CO2 is not the problem, let me just give a little background to this in the next paragraph, which may make things clearer.
I have already shown that Earth has known much greater levels of CO2 in the past. Why would that be?

To properly answer that question we must first understand that methane, much more than CO2, has always played a major part as a cause of climate change. And in order to understand that methane role, we must look first at how the planet has changed over time. We will restrict that ‘look’, since it is not our primary objective, to the period from whence the dinosaurs came to prominence. That is some 200 million years ago (mya), and we must consider what has physically changed since then. The one thing which stands out about that is the shape and position of the world’s continental land masses. The world looked very different 200 mya. The image at right, though not very detailed (about as rough as our actual knowledge of the subject), shows how the super-continent of Pangea – I spoke more on that in my previous article – was just beginning to break apart when the dinosaurs emerged. The third global checkpoint – 70 mya – was the supposed situation shortly before the poor dinosaurs exited the scene as a result of a cosmic intrusion in the form of a massive meteorite strike – or possibly a series of such strikes. That must have been a really rough time on the surface of our planet (and also in the mantle), such that the release of massive amounts of gas trapped in rock and other natural formations would be unsurprising as a cause for rapid atmospheric methane rise. ‘Rapid’ being used of course in the geological context. Methane is such a trapped gas, and methane is also known to be a powerful greenhouse gas. It is clear that methane released by destabilising influences is actually the main culprit for spikes of global warming. That is also something frequently mentioned in scientific papers – but generally ignored due to the gas being mostly hidden – in seabeds and frozen landscapes – whereas poor cousin CO2 is everywhere around us, set up you might say, as the fall-guy for the crime.
How exactly does this work?
The process of continental movement continues even today. Though the last major change was the joining of the two Americas and the rerouting of oceanic currents to be more north-south than east-west, except around Antarctica. There have been a number of massive methane releases during Earth’s history, including in the geologically turbulent last 200 million years. Whether each specific methane release event was as a result of cosmic activity or simply arising from the immense turmoil of Earth’s continental movements, does not really matter. Either or both could play such a role and there is evidence for both. Two things we need to know about methane. It can be upward of 80 times as powerful as CO2 in the form of a greenhouse gas to raise global temperatures. In fact, as methane degrades (producing less heating effect by volume) – as it does over up to a century – it produces a considerable amount of CO2 in that process, which has much less of a heating effect in itself. It is as a direct result of this degradation that we can claim the resultant CO2 to act as a cooling effect on the planetary atmosphere. This is most obviously seen in the immediate cooling effect present following the massive rise in CO2 after the huge methane release at the close of the Mesozoic era. But it is also evident in almost all peak heating events throughout Earth’s history. Peak heat almost always results in fairly immediate rapid cooling. Is this the secret we need to be learning – or at least studying? You can choose to believe what I say here or not. I am not a scientist, nor do I hold a formal science background. What I say comes mostly from a common sense approach and some study of what others say. I do say though that I have seen no-one else come to the same conclusion as I have. It seems valid to me. Others may differ. Is anyone looking at the problem – rather than jumping on the CO2 bandwagon (as a result of restricting their research to too narrow a band-width of geological events) and adopting an obviously false assumption. There is something to be said for non-siloed scientific research.
Ok, well that’s my gambit, take it or leave it.
At the end of the Mesozoic (66 million years ago), it is understood there was a massive methane release, possibly resulting from the same intervention which saw off the Dinosaurs. This huge amount of methane would have caused a consequent increase in global average temperatures. The fact that this also coincided with the start of the still ongoing gradual cooling of the planet does not make sense in any other context than that which I outlined above. This fact in itself should put an end to the obviously false ‘CO2 is the cause of global warming’ connection. Since the Dinosaurs left us, and the Earth began getting cooler, the level of CO2 in the atmosphere has also been gradually falling – but not enough to stay the hand of whatever was the cause of the endemic cooling effect. Except for one period of relative climate stability lasting some 20 million years, a period we know as the Oligocene (and also for most of the following Miocene period) between 40 million and 20 million years before present. During that time, the climate more or less stabilised (this stable period again beginning and ending with large-scale planetary destabilisation events) following a fairly abrupt 2°C drop in global temperature. CO2 levels during the Oligocene remained steady at between 700-800ppm*. Compare that with the relatively low current values of between 400-500ppm* (until very recently it was down to around a disastrously low figure of under 300ppm* – I will explain why ‘disastrous’ in the next paragraph). The Oligocene is well known as the time of major greening of our planet and a time of flourishing of both mammalian and plant life, being both warmer and with higher levels of CO2 than we currently enjoy (as I suggested in my previous article). In order to return to the same ‘idyllic’ conditions – in quotes because not everyone, I suspect, would agree, but temperature variances around the mean were swings of only some 2-3°C (unlike the doubling of those variances in the most recent 6 million years). Our planet definitely needs more carbon dioxide, not less, as I explain next. [*ppm – parts per million]
Another feature of modern global warming which has also been blamed on the spread and activity of mankind is that of increased global desertification – increasing to levels dangerous and threatening for our continued existence. This typical article on the subject by National Geographic (a publication not nearly as human-friendly as it purports to be) – ‘Desertification, explained’ – which while presenting a dire picture of our current circumstances, also follows that line of reasoning that humanity is to blame, never once mentioning the much reduced levels of CO2 as having any causative effect in the planet’s inability to nurture vegetation sufficiently to sustain the population without a great deal of inappropriate human intervention in the form of modern agriculture – which only makes matters worse. If we want a life-sustaining world we need more CO2. Perhaps up to the levels of 700-800ppm as it was back in the good old days of the Oligocene, with its glorious ambient (mean) temperatures of between 16-21°C. Now there is something to dream about. Sadly it is not going to happen …unless… well let’s wait and see.
An interesting Wikipedia article discusses the Oligocene and adds much more detail than I can include here. It also provides this quote which further debunks the current ‘CO2=Global Warming’ myth:
“The late Oligocene (26.5 to 24 mya) likely saw a warming trend in spite of low pCO2 levels”
Low CO2 and also a ‘warming trend’? That doesn’t fit the image we are being fed. The ‘warming trend’ must have been due to something else. The Wiki article also confirms the generally idyllic nature of the Oligocene period, with the statement that:
:Evidence of a relatively warm Oligocene suggests an enigmatic climate state, neither hothouse nor icehouse.”
How lovely. It doesn’t actually say that ‘enigmatic climate state’ was only possible thanks to elevated CO2, but that is the implication. The best we can hope for is a complete turnaround in the ongoing cooling (before it is too late), restored CO2 levels of around 700-800ppm, and GMST hovering around 18-21°C (still slightly higher than current expectations for global warming in our own time – if you can figure out what those expectations are). Oh, and no more massive continental landmass or oceanic movements to upset that ideal.
Global Warming? Are We Instead Headed For A Frozen Future?
Of course, we have to face reality. The more than 50 million year old most recent period of Earth’s cooling (accompanied by the similarly reducing levels of atmospheric CO2) is still also evident today. In fact, for the past 6-7 million years, since the joining of the American continents by the closure of the gap we now know as the Isthmus of Panama and the rerouting of oceanic currents, the pace of that cooling has increased rather dramatically (easily seen on the Global Surface Temperature Chart) and to the point where the planet – in another million years so, appears to be in danger of breaking through the floor of its normal operating envelope to once again become a frozen planet. I’m not saying that will happen, just that we are headed in that direction.
Modern climate catastrophists and others with more malignant motives would like us to believe there is a recent relatively large and rapid increase in CO2 levels (today still well below the planetary ‘ideal’) which have induced consequent rapid and potentially disastrous levels of global heating (and other climate effects), casting ourselves as largely responsible for the development of such a tragic state of affairs. I hope I have shown there not to be a need for us to shoulder that responsibility. There is no reason to doubt the truth of that increase in CO2 and associated climate effects, when viewed only from the restrictive, short-term stance of the only narrow band of time in which any possibility for us to have committed such a crime exists – the past 150 years. When viewed over far greater periods of history, for which we have adequate data to see the matter in the proper light, we see (and I have shown) both the dire situation, and the crime, are shown to be non-existent.
To the contrary, it is clear that the opposite is true. The planet is cooling, not heating. What the short-sighted observers are seeing is a temporary aberration, mostly due to a registered current increase in atmospheric methane, consequent to …well… a great many things if you care to look it up. It’s the methane you fools, not us! Of course our little 1% contribution may have some slight effect, but not enough to matter. The extra methane of course is doing what all methane does – causing heating while at the same time degrading into mostly much more harmless CO2, which is beneficial to all manner of biospheric activity.
These increased levels of CO2 should, over time and by having a limited heating effect, result in a stabilisation of the current trend of global cooling. If that does not occur then we are in a lot of trouble. This is a process of normal rebalancing, made obviously necessary from millions of years of continental and cosmic upheavals which have reshaped our planet. And we have millions of years of historic records to prove that is the case – if we would only look at that with the wisdom of the ages instead of trying to twist things around in some ‘cock and bull’ story of global warming when there is actually the direct opposite going on. The recent increase in CO2 may simply be a natural planetary reaction to stem its own plunge into endless winter – and as a cure for all our misfortunes and our plaintive moans and whinges. A real climate solution, requiring no input from mankind. We could have been subjected to far worse than we may still need to endure as this progresses. Will raised CO2 levels actually be able to turn around the planet’s plunge into icy conditions which would not support our kind of life at all? I guess nobody is even considering that as a possibility for the situation.
But read on dear reader. You’ve come a long way, so far. Don’t miss the best bits.
Take a look at the following chart comparing global temperatures, CO2 and sea levels. I think any reasonable person would agree that there is a fair level of correspondence between all three measures over the past 400,000 years of our planet’s history. Let’s be clear about this, we are talking about less than the most recent half-million years of the past now. To further contextualise this, look back at the first chart I presented at the beginning of this piece, and at the right hand end of the horizontal time scale there where, between the ’10’ and the ‘0’, the scale is split into 10 smaller sections each representing one million years. The whole timescale we see in the chart below represents only less than the second half of the final small section of that first chart. See how the data is so compressed in the first chart that it is impossible to see exactly what is happening (and it looks like a whole lot is happening there). This is the period of time we are most interested in. The time leading up to today (or whenever it was the chart was produced). Everything to the left of that is presented (for our purposes at least) as context for discussing our own present day problems. I hope I have done a good and effective job of using that context to illuminate what we need to know now. The chart below will tell us some of what we need to know. I will use this information to draw the best picture we can from it. I will need to expand that data once more to reveal known events in our history but I can’t do that in this current writing – which is bigger now than I ever intended it to be. The data is very detailed, as a result of the much smaller time-scale. Allowing us to see more clearly just what is going on. The entire age of modern man, or should I say the civilisation of man, occurs between the pointer to the Last Ice Age and the end of recordings on the right. You will notice that, even though parts of the world were covered in ice (it was an ice-age after all), the mean global temperature remained above the 10°C level at all times. So, what can we see?
You could still take the Sun on the beach in your bikini in much of the tropics just as you can today, through the period. I stress that point because I think it will present an entirely new image for many people as to what the GMST really is and why it is so important a measure in all climate studies. Do you see it? The next paragraphs will make it much clearer.

The first thing I wish to note (actually the second, the first (the degree of correspondence) having been noted above) is that of the misleading nature of the temperature anomaly scale in the red line Global Temperature section of the chart. For the average person this is meaningless (as it is designed to be and as most temperature scales are). The zero point is actually the current global temperature (GMST – remember) of around (let’s round it at) +14°C. This means the range of temperatures we are looking at goes from +10°C (shown as -4) to +16°C (shown as 2). Which, I hope, makes the whole thing much clearer. It also indicates that we are living in times when the Earth is undergoing conditions near to the bottom of its own operating envelope for temperature (9-10°C GMST). There is plenty of room for safe higher temperatures (we are never told about that) above the 16°C level. Refer back to the first chart if you don’t believe me – and the ideal temperatures of between 16-20°C which I spoke about earlier. Yes, at a GMST of 20°C there will be parts of the globe where temperatures are at a dangerous level for mankind. Just as today, with a GMST of only ~14°C, there can be periods of the year when some places experience temperatures upwards of 40°C. It just means we will need to be more careful and flexible in where and how we live. And in particular where we grow our food. But remember, all of this slow and lengthy climate process takes many thousands of years of very gradual change to complete. Except that I believe we are already almost at the peak of current warming – having already risen around 5°C since it last bottomed out at the end of the last ice-age and the rise never exceeding a 6 degree increase over the past …well, ever… over the last 65 million years and especially not in the period of the biggest swings occurring over the past half million years. Neither the upward swing nor the long downward slope, over the next 120,000 years will effect the humanity we know today. Not for possibly hundreds of generations. Will our species survive that long? There can be no guarantees. We can hold no vision of what the world will be like across that future, even if it is survivable by those who follow us. Our own civilisation having so far lasted only some 5-7,000 years, superseding the previous which ended in a devastating flood some 13-14,000 years BP (if there is anything to the tales of Atlantis – the flood being real enough for such an event). Nor can we know who or what the prevailing intelligent fauna may be – if there is any in that future. It may not resemble us at all. All of this is the natural progressive nature of …well …nature. It is simply the repeating cycle of birth, growth, and decay, whether ended, amended, or restarted by external intervention, or not.
The next thing of note is that over recent times (half a million years and in fact much longer than that) the GMST has never exceeded 16°C as its top of range (and that would, if it persists, negate all of the concerns I outlined above). The GMST has, over that time, only reached that high point a couple of times, and then only briefly, following a fairly rapid (thousands of years) rise of around 5-6°C from the base level of ~10°C. This has always been followed by a gradual cooling (over approximately 100-120,000 years) to reduce temperatures to roughly – and always – around the bottom level of 9-10°C. We are now reaching the 16°C GMST peak of the latest iteration of that cyclic process. That is where we are, and all the pointers say this peak period beginning with the end of the last ice-age at around 13-14,000 BP. What happens next – and I can’t say when, but soon – is that this peak in GMST will give way to the expected prolonged period of gradual cooling, back down to the usual floor of ~10°C GMST (over approximately, based on previous experience, a period of some 120,000 years). I feel like I am repeating myself a bit here, but that’s Ok – these are important points to understand. Those points gives me – and should be enough to give you – confidence that this pattern will persist into the future until some large-scale interruption once again interferes with the planetary balance mechanisms. Rises in levels of CO2 do not constitute such an intervention. You will also note that the current temperature (GMST), currently around 14-15°C, while still rising – but quite likely not for much longer – has still not yet reached the peak levels of previous similar excursions – for example the previous Eemian level. We are not in any danger of over-heating. The Earth, its flora and fauna (including our pre-human ancestors) have repeatedly survived such cyclic excursions. Many species – up to 90% or more of pre-existing species – did not survive the changes of course. Whether or not we modern humans survive the same ordeal, has yet to be tested and is not a given.
The final thing of note here, and perhaps the most important to why I am endeavouring to put this argument together at all, concerns the CO2 Concentration graph (the middle line of data in the previous chart image). CO2 appear to have, for unknown reasons (currently attributed to ourselves as profligate wasters) taken a massive leap in the last few years (the green line goes off the chart). I have endeavoured to show that this is not in fact a disastrous but beneficial situation. A situation which has little in the way of a link to global warming. That much should be obvious since there has been no equivalent, corresponding, or even vaguely similar leap in global temperatures over the same period. Look at it! Temperature perfectly normal. CO2, literally off the chart. Why is that? I don’t know yet …but I am working on it. And I hope that far more influential people, people who have more at stake in the near to mid-term future than I do, are also working on it. Somehow I doubt that. First the real problem has to be acknowledged. And it is NOT CO2. CO2 could well be what saves our species from expiring in a frozen wasteland.
OK. Well I have already written far too much for one story. I know that because I now cannot hold all these ideas in my head as a single cohesive and constructive piece of thinking with any surety that is what it actually is. So it is time to end it here. I do have more to say, but it will have to wait. You will note that I have not said anything yet about the third, sea level, line in the above chart.
If you have made it this far, I thank you for your interest – whatever drove you to do that.

Leave a comment