
Here is a piece of my own philosophy:
Whenever humans get themselves into a flap over something, that ‘thing’ tends to perpetuate to become a ‘norm’ for future generations.
In other words, what we believe, what we understand, the way we live, the way we are and the way we think, are all a product subject to the accumulated outflows of all the incidents our ancestors have ‘flapped about’ throughout history.
As a definition, because the term has several meanings, ‘flapping’ in this context represents one or both a physical or emotional response – usually accompanied by a great deal of noise – and centered around a state of panic or alarm.
Nowhere is that more apparent, of course, than through recent events in the long history of humanity.
Since the latter years of the 20th Century, modern humans have gotten themselves into a flap over climate change. But is that justified? Is that warranted? We were told that global surface temperatures were rising fast and would soon reach catastrophic levels likely to detrimentally influence the future of mankind. The push was backed by ‘science’ or at least what was said to be a majority of scientists, which led to years of vehement argument between those who championed the idea and those who opposed and actually declared the world was cooling. ‘Trust the Science’ we were told – and not for the last time did we hear those words. Have we been subjected to a fraud? Remember COVID? Yet another fraud, also backed by ‘science’.
The previous generation – my parents and grandparents, your grandparents and great grandparents – knew nothing and cared nothing about ‘climate’. Only the weather, which was more or less standardised and reliably predictable, was of immediate interest. They did however, I suppose, get into a flap about one particular thing which was new to their age. And it was the increasing global nature of warfare, which was previously more of a localised or colony based activity between two opponents. Such globalisation of conflict, though in reality being mostly regional and generally restricted to involve conflict between two or more groups of ideologically aligned nations), which grew to be accepted and eventually became the norm. This fraudulent imposition on human societies, again enabled by advancements in science, continues relentlessly even today and birthed the lucrative military armaments industry which is now an essential component of modern economy. Even, it could be said, an industry foundational to the very existence of large nations.
Also beginning with that previous generation which, yet again aided by science, from which we could for the first time deal with pandemic illnesses pharmacologically, we have seen the endemic rise of the pharmaceutical industry. A blight which has more or less seen the demise of natural health remedies and which has trapped a large section of humanity into addictive reliance on its manufactured chemical products, at the same time reducing medical workers to the base level of pill-pushers and arm jabbers. A fraud, purely based on profit, if I ever saw one.
In the same way, ‘climate change’ has been developed by capitalistic theatre into another booming industrial complex. The only pure objective of which, since it is based on capitalist fraud, is the fulfilment of the profit motive by the perpetual exploitation of a captive market.
Feeding into that we could also talk about the rise of the pseudo-food industry. All of these things, these new industries, have been developed to be the norm in our age as a direct result of a perceived and/or manufactured crisis about which humanity was driven to make a ‘flap’.
Is this to be the future of mankind? A world where capitalist entrepreneurs manufacture one ‘flap’ after another, provide a ‘solution’, further perpetually enslaving and subjecting mankind to their ‘product’ offerings – good or bad – but always profitable for themselves? A world in which the guinea pigs are kept ‘happy’ but own nothing, until they are of no further use? At which time, will they be fed into some ‘end-of-life’ process as another ‘for profit’ venture? Is this the reason behind the climate change ‘crisis’?
Ok. Enough of that. While what I have said above is, I believe, firmly rooted in that rarest of commodities these days – the truth – I must acknowledge that for many it will still be seen as purely subjective, or worse. So if this is to be seen as at all a serious endeavour of mine, I need to show that ‘climate change’ is actually a fraudulent invention of capitalism, while arising from what may well be a truly catastrophic future for the world of mankind, centered around actual developments in the natural world in which we exist. I believe I can do that. And it is not magic, or fraudulent, or some flight of fancy, but factually based on what we see, what we have discovered – scientifically – from information deduced from what is found in our untouched, historic natural Earth records laid down over half a billion years, under our feet.
Science has made these discoveries for us. We need to use them. And not be fooled by what others may want to pass on to us for less than pure motive.
This way of thinking is new for me. I was one who was caught up in the climate disaster theory. Even attending some ‘climate change rallies’ and voicing my alarmist views in blogs and on social media. But I was always a reader, and I read widely. Some of what I read in those years began to nibble at the edges of the climate zeitgeist. I began to formulate a different image of the climate situation. But it is only in recent days, only since COVID, that I became convinced the whole subject needed to be turned on its head. The picture I intend to present to you now is very different.
Much of what ‘science’ tells us about climate change is based on events and developments occurring and available only over the past 30-40 years or less (the age of orbiting satellite measurements). If we examine only the records of the last 30-40 years, those records do tell us that over that period the Earth has been gradually and now rapidly heating, which if continued would potentially have disastrous results for the planetary biome – including ourselves. And that could be held to be actually true. that such temperatures have not been reached since approximately 120,000 years ago. That is also undeniably true (and has been factually used in the past by climate skeptics to show that current temperatures are not something unique to this age). It becomes particularly disturbing when we realise that at that point in time, 120,000 years prior, there were not 8 billion humans, plus a far greater stock of their feed animals, living on the planet, in an overly complex technology based society where only a narrow band of temperature fluctuations are tolerable to life. This has made it easy for the powerful – which categorically translates to ‘the rich’ – to propagate a message that we are in a state of great danger. But is this true? At all, or in part? Let’s see if we can determine that, and estimate the level of risk to our way of life (or life itself) if there is one.
I have borrowed a few images, mainly from the article – What’s the hottest Earth’s ever been? – NOAA – June 18, 2020. Don’t go there now, what I have to say is much more important. Some information there is actually erroneous and much requires some interpretation.
We will begin with a condensed image depicting the whole known geological history of the planet. Much of it is guesswork – as is much of all scientific study – being based on theories, which tend to change and are represented only by the latest of such which have not yet been disproven. If you take that mindful approach to science, you will never be far wrong.
I position the image here. Familiarise yourself with some of its features but draw no conclusions until you have read what I say below.
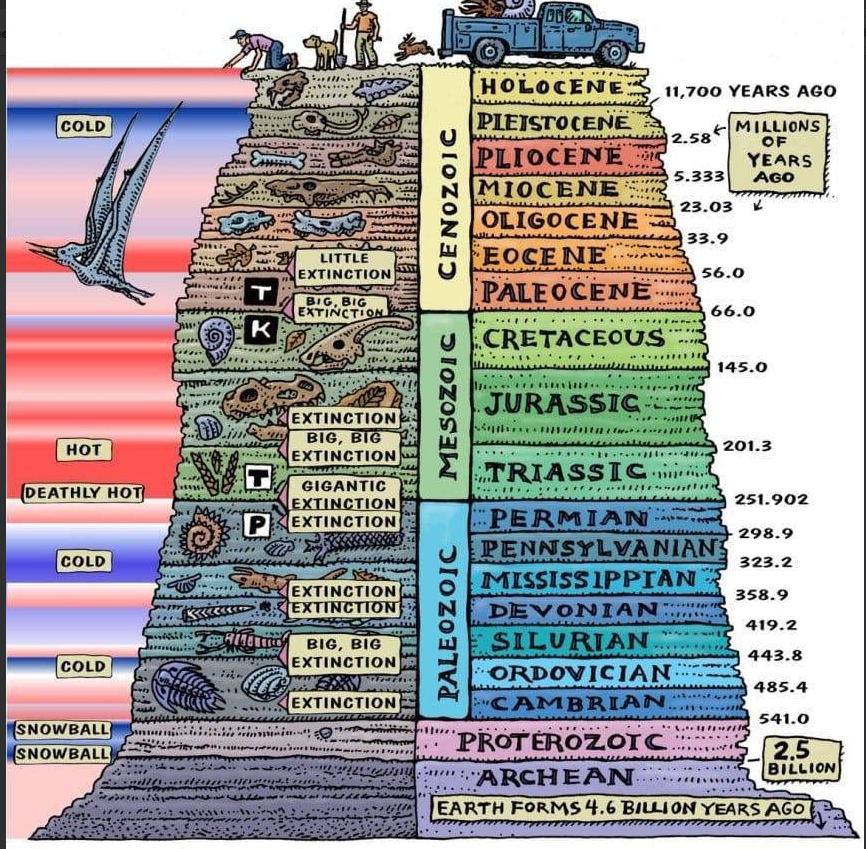
The first thought to broach is that this image has a vertical scale which begins as ‘years’, quickly changes to ‘millions of years’ and finally to ‘billions of years’. So it is in no way linear and ridiculously over-emphasises the length of our current age, the Holocene, which would be more accurately depicted as the thickness of one of the black lines which separate the listed geological ages on the right.
Next we examine the far left of the image. This represents the average global surface temperature of the planet over time, and we are only interested in the period of approximately 500 million years from the Paleozoic era (the bluish coloured ages) up to today. For the earlier Earth history – labelled ‘Snowball’ because we know very little about it (to the best of my knowledge) and there being nothing of interest to our discussion here, we can ignore.
The first thing to note, and note well, about this hot/cold sequence is that there should be no blue shades anywhere above the ‘Snowball’ time boundary. Yes there have been some ics-ages in that 500 million years, but at no time did the average global annual temperature fall to or below 0°C, or even below 10°C. Therefore those bars shown in blue colour should actually be a very pale pink, sometimes for relatively short periods approaching to white. The ‘hot-pink’ of the bar at the top against the Holocene, in fact the whole of the Holocene pink area – today’s situation – should actually be fifty shades of off-white with the slightest of pink tinges.
The use of the blue to represent cool/cold here is just an example of subliminal (unstated) influence, and the ‘hot-pink’ bar at the top is simply an overt lie. I use the image only to illustrate these falsehoods and in order to familiarise with the general layout of the historical geological ages, so we can all be talking about the same thing.
Now let’s restrict our viewpoint to cover just the past half billion years of our current not necessarily clear or accurate knowledge of Earth’s history. Always remembering that this period which is relevant to our study, represents possibly only little more than 10% of the time the planet has existed.
I introduce a graphical representation of global temperature this time. Imagine the first image, or the part above ‘Snowball Earth’, tipped over to the right. So today is now on the right and we have discarded ‘Snowball Earth’ from the left, leaving us with the most recent 500 million years of temperature records. I should say here that we are necessarily taking on trust (because it is the only data we have) that the scientists did a reasonably accurate job of deciphering the physical records they collected for this purpose.

We note again the use of red and blue colours but we are now aware that this colour regime does not represent actual temperature. It is just another case of subliminal influence. Imagine, as before, the blue line to be pink, or red if you choose – it makes little difference. It simply marks a point on the temperature scale at which the graphical analyst chose to place the level at which the world would either have or not have ice-caps at its polar regions. That does not equate to ice-ages. We have polar ice-caps now. We do not live in an ice-age. Facts are facts. Influences of perception can only twist a person’s concept of reality. Influences of perception are rife today.
Note also the temperature scale at the left. It is in degrees Fahrenheit – an archaic scale used by backward nations, which serves no useful purpose in today’s metric calibrated world. But you should be aware that 50°F is equivalent to 10°C – well above the freezing point of water. At no point in the past 500 million years has the average global temperature dropped below the 50°F/10°C point.
Final points to notice from this graph, see that the ice-cap boundary temperature has been set at around 67°F, which is 23°C as far as I can estimate from my dual scaled Cobb & Co Clocks wall thermometer. Whether this setting is true, I cannot say. What I can say is that the majority of this whole period has seen global temperatures way above that level, and that there was no-one around in those times (at least no such so far discovered) to see or to record whether or not there were polar ice-caps for all or parts of those times. That may or may not be important to the climate issue. We are still here, are we not?
Final point. Examine the temperature line representing the most recent 65 million years of history. You will see (from a little to the left of the ’50’ on the bottom timeline scale) that the ‘ups and downs’ [that’s a technical term] occur a little more frequently. This probably signifies that we have better data for that most recent period of history. I want to examine that more closely next but, please note, from the labelled Paleocene-Eocene Thermal Maximum, the trend in temperature is consistently declining (becoming cooler). Except for a rather over-dramatised final splurge upwards, following an over-emphasised dip, to today. But is that true, or is it just another designed influencer to reinforce the image we are meant to accept? Move on to the next chart to see more clearly.
Now we can see the trees from the wood, so to speak. Although not as clearly as we will when we move on to another chart after having more closely examined this one. Here is depicted the past 65 million years of global temperatures.

The first thing to note is that at the very beginning of this chart lies the point, 66 million years ago when, as I expect everyone will understand, the extinction of the dinosaurs occurred following the ‘Earth shattering’ collision of our planet with a giant bollard, mostly described as an asteroid. As big a disruption as that must have been to completely destroy a whole genera of life, it was not accompanied by a huge disturbance in the temperature record. There appears to have been an approximate and relatively sudden 2°C drop there, visible on the chart but there have been many such changes, both up and down, especially during the even more recent history and not many of those changes can be attributed to such a catastrophic event.
For most of this period, from the high point of the Paleocene-Eocene Thermal Maximum, a point useful for referencing back to the previous chart, it is now convincingly obvious that our world has been in a 55 million year period of mostly cooling temperatures – and no sudden spike upwards as shown at the end of that earlier chart. But how low has the climate sunk?
Well, we no longer have to contend with the vexing red-blue issue. Everything is appropriately shown in red. But the cartographers or chartists have introduced a new focus – a zero point on the temperature scale on the left, with negative values below and positive values above. The immediate thought would be that this represents 0°C but it doesn’t. It is the iconic (in the sphere of climate change) value from which all temperature variances should be calculated – it being the average temperature prevalent between the years of 1850 and 1900 – deemed to be the beginning of the period when the industrial age may have started to have some effect on climate statistics – the zero point for climate change. The year 1850 was in fact the first year that attempts were made to calculate global average temperatures from data current at the time.
Whenever the ruling authorities do not like the current figures derived from that foundation point they use a different, more recent baseline – especially when publishing the effects arising from their climate change abatement efforts – aka: ‘Keep the Economy Moving’ and ‘Make the Rich Richer’ schemes.
But what is the actual figure for that baseline temperature? It is hardly ever stated, and a quick search will not reveal much. Here is an image which actually tells us (and it took a long time to find).
I should point out here, in passing, that such graphs as this one, deliberately chosen to indicate rising temperature (without giving any context) are the usual fare for climate change pushers. And yes, it does look like it is getting hotter. But by little more than 1 degree? Pffft! Context is everything!

So, it was ~13.5°C in 1850 (same in 1900), and the current average is ~1.2°C above that, at ~14.7°C. That may have been the first time you have seen those figures. You may like to note that neither of those temperatures vary much from the lowest ever recorded or calculated over the last 500 million years. Astounding, no?
Now, I want to take this line of thought one step further, to examine the most recent 5 million years of climate temperature history. Please bear with me, you may sleep easier tonight.
The following chart is in two parts. The first (upper) part represents the most recent 5 million years of temperature records. The lower part expands the final 800,000 years of the upper, to illustrate more clearly. The image comes from NASA, so we can treat it as more or less reliable. I disagree on one point. NASA states in the accompanying write-up that the Holocene period – indicated by an arrow at right of the lower part – covers the most recent 10,000 years. The Holocene actually began 11,700 years ago with the end of the relatively short Younger Dryas freeze – another event affected by cosmic interference, this time from cometary impacts over several years.

Probably the most important feature to recognise here and to give the whole thing the correct setting, is that on the temperature scale at left the zero point represents the peak temperature during the Holocene – which, since the image was produced in 2011 could actually be (by estimation from the 1850-1900 baseline chart above) more or less ~14.3°C. So these two identically scaled charts represent temperatures between 8.3°C and 16.3°C. At no time close to freezing point, nor even yet reaching the 2011 +1°C mark. To me, that does not spell danger of any kind.
Again, in this chart the continued gradual cooling of temperatures is clearly seen. One important feature which cannot be allowed to go past unnoted, is that during the Pleistocene age the variances in temperature are gradually becoming more widely spread but more volatile in their magnitude. Some of the most recent changes from low to high are of more than 5°C and occurring as rather abrupt changes geologically speaking, though still covering something like 5-10 thousand years. But since the most recent upsurge of 11,700 years ago was preceded by the often quoted 120,000 years to the Eemian event. The most likely next problem will be that we have to gradually learn to live (over the next 120,000 years) in a 5 degree cooler world – starting round about now. Sometimes I can even feel it – or is that just my old bones talking, as I hibernate my way through southern winter.
I suggest that the most important field of research now should not be how to stop the rising temperature (I laugh, scoffingly, at out hubris in even considering that thought), but to investigate what the cause may be for the relatively sudden and massive 5 degree rises in temperature. That is something scary. But it is not a recent feature. My guess is that the planet will continue on its gradual path of cooling, with occasional short leaps to where we are now. We can cope with that, surely. Maybe even plan for it, if we really are that clever. Although there is a niggling thought that maybe these newer perturbances and fluctuations are the overture to the next ice-age. We have never had the quality of data we see now, so it is difficult to say. But you know that when things, big things, start to shake and rattle, soon something is going to fall apart. It’s natural.
OK, that’s all I really had to say, but I will add a few further notes.
Temperature is of course not the only consideration when discussing climate change but it is, I think, the most important one. Possibly equally important is that of sea level arising from ice-melt, but neither of these things are given prominence in current climate discussions. Carbon content of the atmosphere has been chosen as a diversionary focus point for such discussions because that can be loosely related to temperature change without actually bringing that vital measure into the argument. You now, I think, know why.
The source of the image above, coming as it does from NASA (link below), also provides some pertinent information. Perhaps the most important of which is that during the whole Holocene period , in which we now live, both temperature and sea level have been relatively stable. Maximum average temperatures having been only some 1-2°C higher than today’s. With the trend being toward Earth cooling rather than heating, as I think I have shown, there is no chance that we will see higher figures than have been revealed in this recent past. The ‘Greenhouse Earth’ still occasionally mentioned, occurred more than 200 million years ago. It will not return – at least in timeframes with which humanity needs to concern itself.
File:Global temperature relative to peak Holocene temperature, based on ocean cores (NASA).png
You may also like to read the recent article linked below on the rabid reactions to statements not unlike what I am saying here. When the 2022 Nobel Physics Laureate, a top scientist, says in this quote from that article:
Last week, Clauser observed that misguided climate science has “metastasised into massive shock-journalistic pseudoscience”. This pseudoscience, he continued, has become a scapegoat for a wide variety of other related ills. It has been promoted and extended by similarly misguided business marketing agents, politicians, journalists, government agencies and environmentalists. “In my opinion, there is no real climate crisis,” he added.
Cancellations Start for John Clauser After Nobel Physics Laureate Speaks Out About “Corruption” of Climate Science
A final quote:
The same team that tells us that we must ‘listen to the experts’ won’t listen to any experts they don’t like. They rave about ‘UN Experts’ that hide the decline, but run a mile to avoid the giants of science. They’ll ask high-school dropouts about climate change on prime-time TV before they interview Nobel Prize winners. It’s a lie by omission. It’s active deception. And the whole climate movement is built on it.
I am unsure who said that. It is an embedded quote from the article linked above.
This article has been an almost complete turn-around from my previous stand on climate change. It has arisen from long deep-seated doubts on the discarding of the historical perspective coupled with an even deeper mistrust of anything upheld and pushed by the establishment. And there are few issues being pushed by the establishment harder and more vehemently now than climate change. This, together with the growing list of similarly based establishment scams aimed at controlling humanity, formed sufficient basis for me to review my position. The climate is changing. Being an intrinsic part of the natural world, it has never been a static feature. But it is nothing to fear and, at the same time, nothing we can noticeably alter or in which we should in any way interfere.
For me this is a rather long article, and since I do not have a script reader, paid or unpaid, there may be places where I could have done better. Please allow a little leeway for mistakes.
