
It is pretty clear now, that 2026 reached its peak sea ice formation around Mid-March and has narrowly failed to live up to even the poor showing of last year. A new low for this task – if the data can be trusted – and that is really all we have to go on for these details. I’m sure someone in the alarmist ranks will make a show of that as being some sort of proof of drastic climate change. Nothing of the sort of course can be inferred from this. The decade peak average (for the 6 years so far unrolled for the ’20’s decade) remains only marginally below that of the previous decade since for 4 of those 6 yrs the Winter peak was higher than that previous average. This can all be seen in the image below.
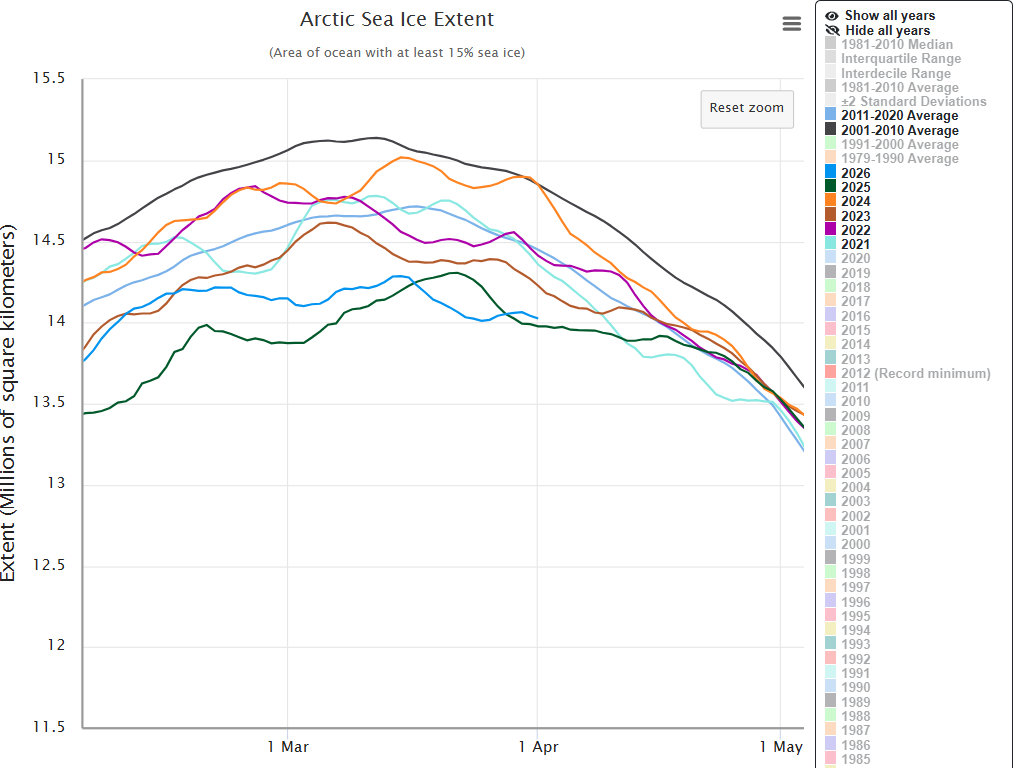
If, as I suggest, after the remainder of the decade has rolled out, that average remains as either a slight net gain or even a slight net loss from that previous decade average, and at this stage it appears unlikely to be anything different to that, this would signify either a complete stoppage or a reduction in the loss of ice growth suffered over the last four decades at this time of year. This, together with other markers throughout the year, would be commensurate with the idea that such ice loss has now ceased – as it would be expected to do if the current inter-glacial warming period was now passing. As it, sometime around now should be, according to past historical precedents.
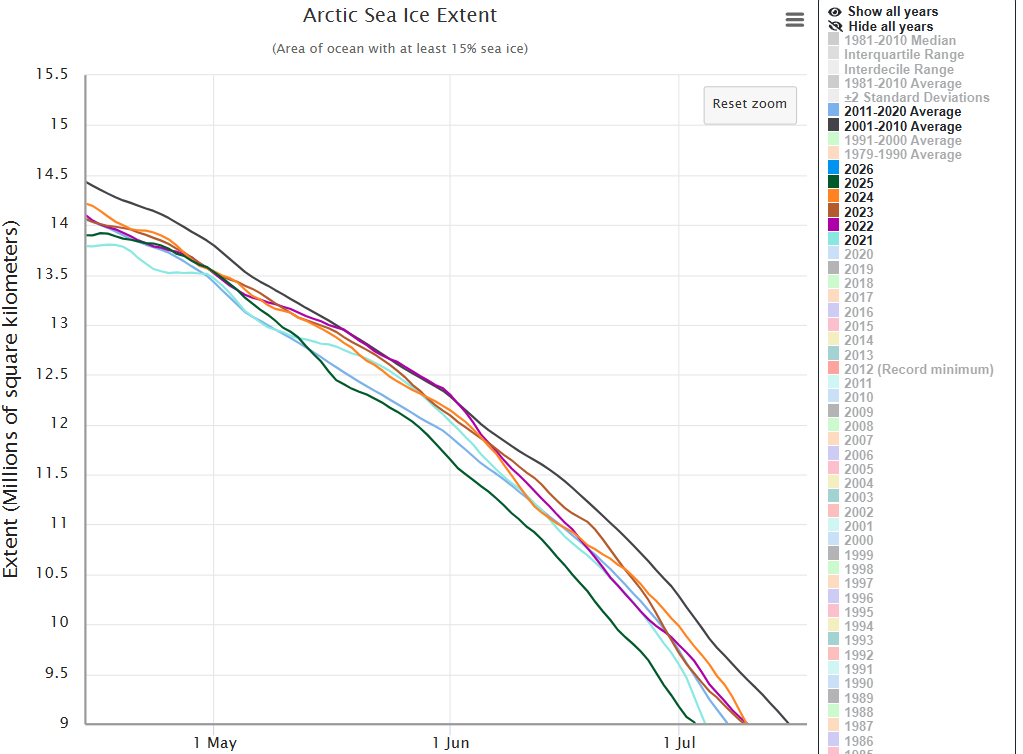
The next annual marker, it is interesting to note, is that at a point towards the end of April, continuing through May and June, and for every year of the decade, the sea ice extent values will cluster together in a narrow band mostly between the average lines for the previous two decades. I expect this year will be no different. This can be seen for the earlier years already in the image below, with 2025 acting as a rogue year in that respect.
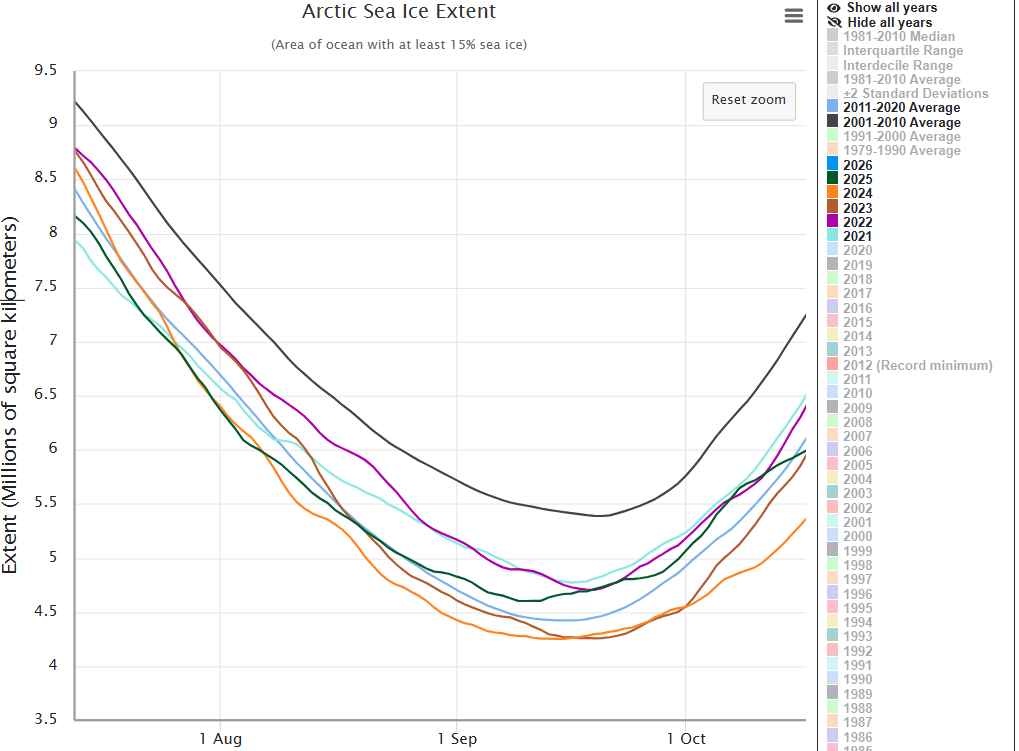
A third annual marker is the Summer peak sea ice melt occuring during September. We have another 6 months to wait for that. It is also interesting to note, that a low Winter ice formation often, not always, leads to a reduced following Summer melt loss. See the green line for 2025 in the image below, which year had by this time reformed its behaviour to return to some form of normality.
If 2026 acts in much the same way as 2025, then we are likely to see a continuation, perhaps even more marked, of the trend already established for this decade. Which will indicate a considerable lowering of sea ice melt at Summer peak – with 4 years considerably less than for the 2011-2020 decade – i.e. some way above that decades blue average line. That will make it very difficult for climate alarmists to argue for runaway Arctic sea ice melting. Don’t you agree?
That is about all I can say at the moment.

Leave a comment