
If you have been following my blog for some time, you may have noticed I did not produce a month end status report for Arctic Sea Ice earlier this month. I decided that was not a useful exercise for me to continue due to the not particularly stable nature of the data reported on the NSIDC interactive chart website. Not that that seems to worry their chartists too much. I guess that is simply part of what is becoming a general rule that nothing much coming out of the US is actually trustworthy these days. The sea ice data points on their own charts does not mostly agree with that recorded in their own database. Not far removed from it but rarely accurate. A fact I was astounded to discover during January.
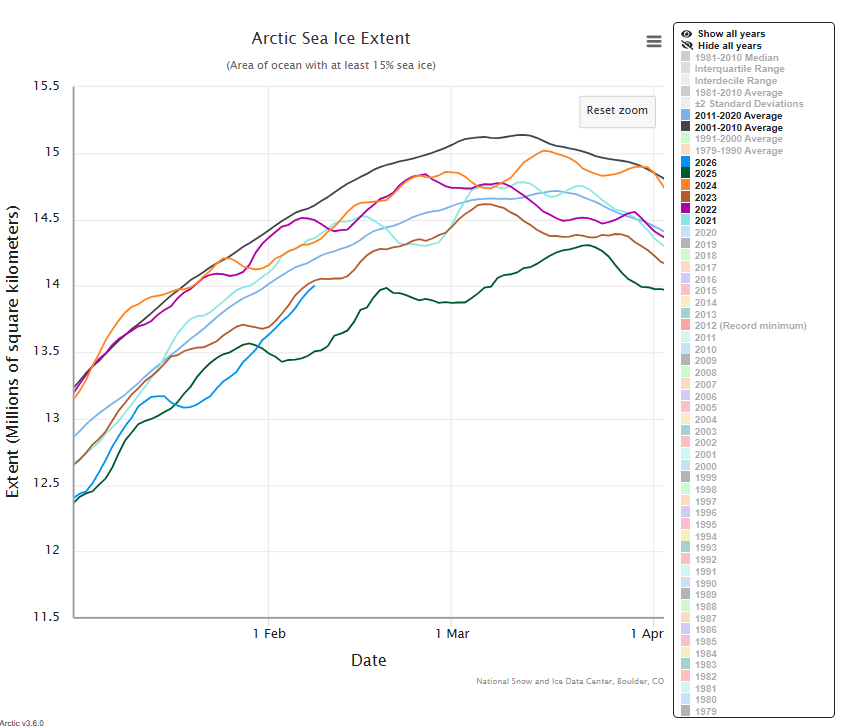
That being so, I have decided to cease recording their end of month data for spreadsheeting purposes. I don’t want to be associated with figures that are not reasonably accurate, or at least verifiable from some source. But I am prepared to keep using their charted data as a reasonable approximation of actual events because it shows the situation in the Arctic is actually following a course that would be expected to occur round about now, based on historical records. Records which are also the best we have on which to make such judgments. And the judgments we can draw from that approximate path can be reasonably assessed as not being in keeping with the majority view of modern climate change. Instead they draw the picture for us that the rapidly increasing ice loss in the Arctic Ocean seen over the previous several decades has ceased over the course of the current partial decade and has turned to a more or less stable state, in keeping with that of the previous most recent complete decade, 2011-2020.
This, logically, could be seen as a necessary precursor to an expected reversal of annual ice loss, to one of increasing ice mass as a floating cover for that ocean’s waters. It is also not beyond the bounds of possibility that we are witnessing the actual end of the current warming inter-glacial period and the tentative beginning of the next glacial period as part of the continuing cyclic history seen over recent climate ages (several million years) as repeated warming/cooling periods, each covering periods of approximately 120,000 years and each occupying much the same range of temperature change – both high and low.
That is quite an exciting prospect to consider. And whether that quite minor global change has started now, in our lifetimes, or this is just another quite insignificant bump in the road, similar to what has been seen several times already over the last 10,000 years of human history, that is during the Holocene period, many of us alive just now, may well witness more concrete proof as climate begins to very slowly cool over those lifetimes and way beyond, to return to the base level from which the cycle began. That slow cooling taking potentially five times longer than the quite rapid warming which oversaw the dawning of our current civilisation of man.
For now, we can only watch as the data unfolds day by day, with 2026 seeking to claw back some of the ground lost by a tardy 2025. As the year appears to be drawing us to an ice status more in keeping with the average line for 2011-2020, I will be focusing on the high point of ice build occurring some time in March and the low point of ice melt in September.

Leave a comment