
Latest on Arctic Sea Ice and What it Means
Around mid-September I noticed that our world had now passed the Peak Arctic Ocean Summer Ice-Melt. This is the marker for the time, every year, when there is the least surface ice coverage on those waters. It occurred this year at roughly the usual time – the middle two weeks of September. Actually on the 12th day of September and perhaps a little earlier than normal. Subsequent to that important point, sea ice regrowth is turning out to be something quite remarkable, in spite of the dumb position that Grok AI takes on that – which I will speak more on later. I want to point out here, something of great importance. Sea ice is never lost. It always grows back. And that will never alter. It will never change. If it did alter or change, then we would have a problem. Currently we do not have a problem with polar ice loss, at either end of our planet’s axial pole of rotation. Get that straight. It is crucial to everything else i want to say here, which will prove the point. We have been fooled by unscrupulous men into believing there is a climate crisis. Categorically, there is no such crisis. We, and all present life-forms, are in no danger from natural variations of the climate which has always existed on our home planet. Be assured of that. There will be losses of course. Since life has existed here in any form, losses have occurred. That is natural. It is part of nature. And if life tries to make a home for itself in places where such is not safe, even though it may appear to be safe and perhaps has been safe for long periods of time, that will not always necessarily be the case. There are no guarantees of safety. No assurances that all will always be the same. Risk is part of life. But by now, we supposedly intelligent humans should at least be aware of most if not all of those risks, and conduct ourselves to minimise them. Apparently we are not capable of doing that. But that is no fault of the planet. Nor is it the fault of climate, which still operates – as it always has done – never wavering one iota from its set boundaries of activity. It seems we are too dumb to understand that. Or we are too arrogant to care, thinking we can rearrange things to our liking, or in fact surrendering to the lunacy that we are somehow in charge of what goes on here and can adjust it as necessary to meet our needs. Neither of those things are true. We either learn to adjust our expectations or we live in constant danger – blaming everything but ourselves for our problems. Some of those dangers can utterly destroy us, as they have to species present in our distant past, but who would care?
Anyway, back to end of September. Peak melting of the sea ice has passed and ice regrowth is proceeding apace, promising a strong growth result by end of March next year. This year is in line with the top two performing years of the preceding decade and in fact four of the six years of this decade are above preceding decade average for end of September. The current average at this time for the current decade is well clear of previous decade average, bringing hope that the next four years to 2030 will align with this position. The NSIDC Arctic Sea Ice Extent is an interactive image which you can adjust to see the data you wish to see.
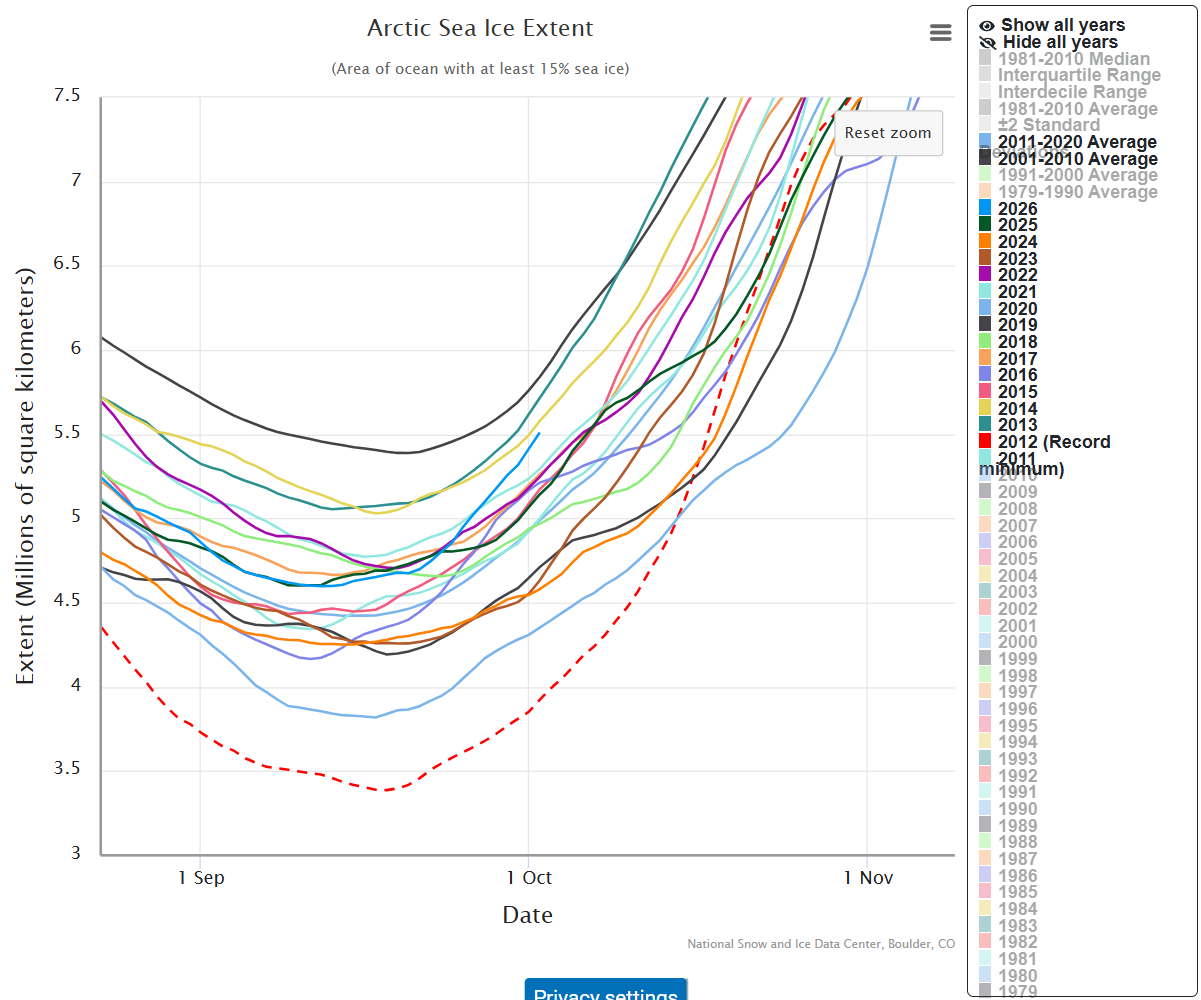
So, what is it about this which is worthy of note? First, the peak of melting, the Summer high point of low sea ice, this year, is roughly 170,000 square kilometres greater than the average ice-melt peak for the previous decade. Meaning in simple terms, that there is more ice remaining, this year, as a basis on which to build next year’s new ice growth – a process now under way and ongoing until late March 2027. This annual renewal of the ice lost over Summer, is unlikely in my non-academically reasoned, self-constructed view, to be weakened by the much talked about though so far quite tame super La Niña event about to hit Southern Hemisphere (SH) waters. In turn, that event may trigger drying and drought on land areas in its path. It will undoubtedly warm the SH ocean waters a little, adding to the negative but barely noticeable overall effects on climate, but will have no effect on Northern sea ice growth and we can again ignore any minimal effect it may have on Antarctic ice – which is steadily growing and is likely to remain so. All of this, taken together, means there is nothing to worry about regarding ice conditions. It ain’t going nowhere yet, and when it does, that will be towards expansion, not contraction. According to my observations, this year’s remaining sea ice activity is likely to remain close to the current average level for the incomplete current decade over the remaining months of this year, but a significant amount above the average for the previous decade. That makes this a remarkable situation at this stage as I have previously stated and will discus further. This is not surprising, unless you have anchored your trust in modern climate theory, but is in complete accordance with the long term cooling of the planet, which may continue for millions of years yet, and of which I will speak more below.
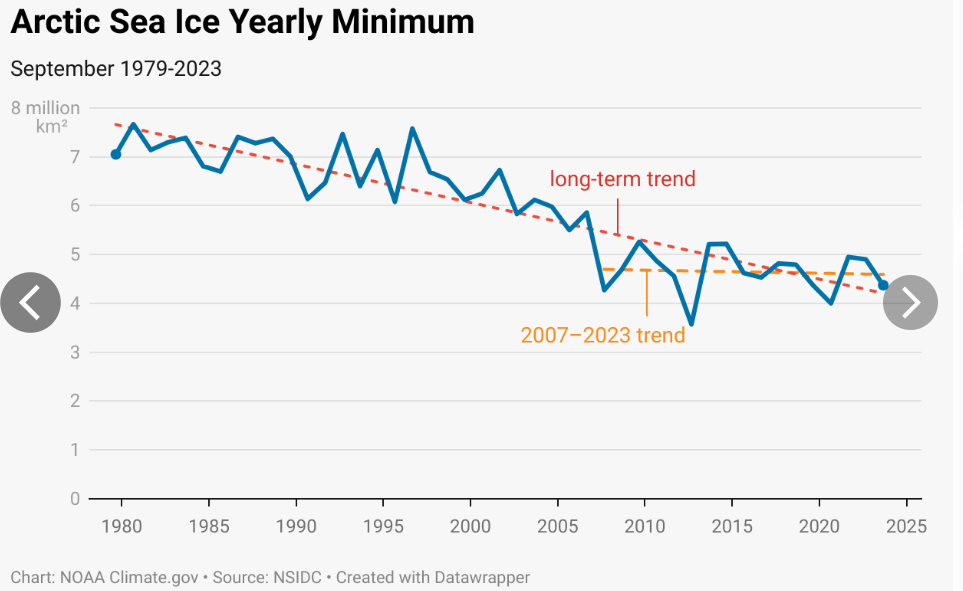
This new trend to which I have alluded here – moving towards more stable and potentially growing sea ice levels – is also being noticed by a growing number of observers, including some NSIDC scientists, who have indicated and charted a beginning for the change (again using real data, not modelling) to have occurred somewhere around 2007 (see following chart made in 2023 showing a new trend line from 2007 onwards). The trend, which also continues and in fact only grows stronger over more recent years, carries implications that are quite astounding. It spells a welcome end, thank goodness, to the ‘global warming’ myth so ardently and deceitfully presented over recent decades. No more million square kilometres per decade sea ice loss as has occurred over the last two complete decades. And maybe a return to sea ice growth (already showing indications in the data of the current decade so far). I am more than convinced that this is exactly what lies ahead in our future.
To provide even clearer evidence that nothing of a catastrophic nature is ongoing with Arctic sea ice, over the whole era of satellite recording, are the following supportive facts. During Summer melt seasons, the Northern ocean waters have actually only lost less than 2.5 million km2 of sea ice cover in total – based on decade averages. That is, the difference between slightly less than 7 million km2 of remaining ice at Summer peak through the 80s and 90s. and more than 4.5 million km2 remaining ice during recent decades as shown in the chart mentioned above. Mitigating that loss is the fact that during Winter ice growth, only a one million km2 loss has been recorded in total, over the whole period. So the total loss of ice has been around 6% of its total surface coverage. Hardly a catastrophe considering the background of a cooling planet and in no way at all unique. I suggest the this loss and regain is part of the historical pattern recurring during each and every minor warming-cooling cycle for at least the past several million years since the Northern Ice field last formed. It is an entirely natural process of which we should take advantage while it still lasts until the imminent end of the favourable warm inter-glacial which enabled our civilisations to flourish. Russia is already preparing for the onset of that possibly civilisation ending event, by building a fleet of nuclear powered ice-breaker ships to extend – if only for a short while – that rare trading period across the Northern sea route which only opened to enable trade just a few years ago. This, until that route closes again, is the best opportunity we are going to get for a long, long time. The evil west (US, EU) of course are planning to disrupt that trading opportunity, which is of benefit to the rest of the world but not to themselves. Fortunately they have nothing with which to enforce such disruption, and are likely to sink into oblivion, economically and militarily, before they can do much damage.
I keep straying from the sea ice theme, although quite legitimately. Let’s return again. In simple terms, what I have already described means that pretty much all sea ice which melted over Summer months for almost 50 years now (the orbiting satellite observation period), has been replaced by annual regrowth each and every Winter. Melting of the ice was the major issue as it constituted a temporary trading advantage for humanity (which only few of us have realised), not the actual temporary loss of ice cover due to a naturally occurring brief warming period and falsely blamed on ourselves by unscrupulous elements within our society. The brief period of excessive melting now appears to have been stopped dead in its tracks (this is the stabilising new trend of recent years). The result of this, over time, being the laying down of more and more multi-year ice as future years roll out. That is, of course, in our future, and not yet in our hands to bank on. But the signs are good that it will happen – whether now or soon. With a growing ice level, such ‘old’ ice will be much more difficult to melt. This sea ice revival has not noticeably materialised as yet, in the form of increased regrowth. But that is at least something to be expected. Regrowth should, over time, begin now to increase. First to recover the lost 1.5 million km2, the 6% I mentioned earlier, which has not yet recovered through annual regrowth, and later to further expand ice coverage beyond that. I have tried to express, not as clearly as I would have liked, what that will mean for the future in several previous posts in past writings. I am not going to repeat all that here. Please think about it. As the planet continues to cool, what else could we expect? But never fear, we are not going to become an ice planet, as some believe. See below.
We are now almost at the coldest point our planet has ever been*, based on the more accurate and reliable long-term global moving average temperatures rather than the erratic, more frequent vertical girations of shorter interval temperature measurements which are the only ones considered by modern climate science.
*The Earth has been at this same temperature point ~10°C a number of times in the remote past (the most recent half billion years of our natural climate regime – beyond that, nothing can be deemed certain), the depths of extreme cold extending for periods usually measured in millions of years (and we are currently a little less than 12°C by long-term global average and presumably on the way down to another 10 level [that always seems to be the way it goes after a ful 5-6 Celcius rise]).
I will take a pause here to say more around the brief explanatory note above. This low point (~10°C) is what I term the Lower Limit of Earth’s Temperature Envelope, the Upper Limit being around 30°C, both extents measured by long-term global average. This envelope has never been broken in the past half billion years, according to the records we have available and probably for much longer than that. The upper and lower limits of course do not represent the absolute temperature extremes at various points on the planet’s surface (because they are global averages), and they are quite infrequent in occurrence and not representative of the majority of historic time (by which I mean the planet’s overall temperature is most often somewhere in between those limits). It must be remembered that when we talk about such distant periods of time, we can best express that and provide meaningful visuals in charts covering such vast time periods by utilising long-term moving averages to smooth out the data.
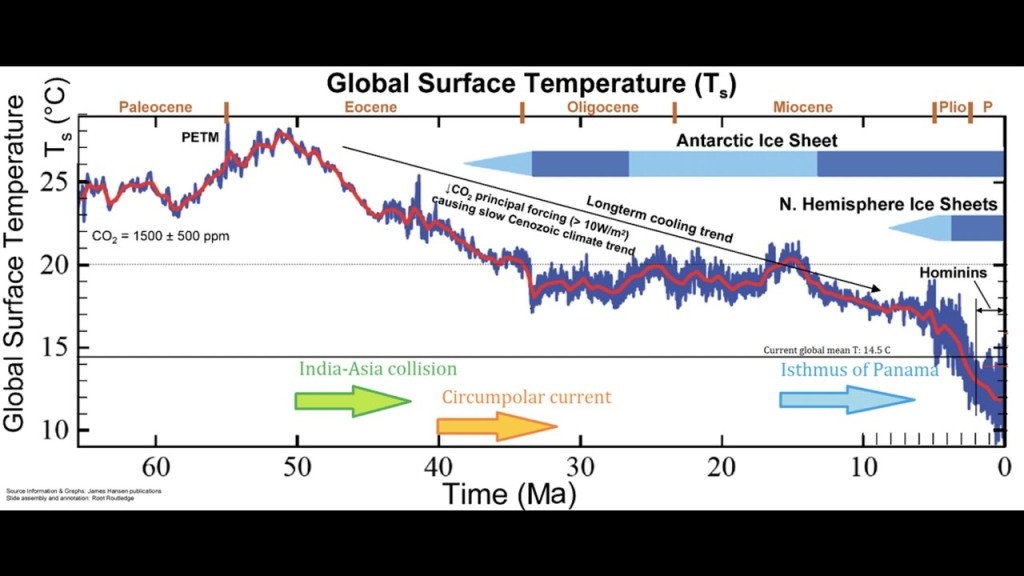
This is amply illustrated in the Global Surface Temperature chart below – which you will read about next. The red line indicates the path of a long-term, perhaps five hundred thousand year global moving average (my estimate because unstated), while the zig-zag blue line around it represents a shorter term (possibly hundred-thousand-year global moving average) and therefore appearing as a more erratically moving line. Only the red line makes sense in terms of reasonably interpretive accuracy but it is the blue line which causes all the erroneous angst among climatologists when observing the ups and downs of current global average temperatures. The reader can surely see the error in taking such a position, I hope, or in the even wilder errors produced by using annual average temperature measurements, as they occur, or can, with minimal accuracy be predicted, in drawing their alarmist conclusions. Those results being fed into AI teaching plans will produce only GIGO-AI-BS in supposedly scientific articles such as the second one on Milankovitch Cycles I will introduce below.
Moving on to a few other interesting climate related matters…
…matters raised based on historic precedents designed to dispel any fears you may have in relation to the fear-mongering which currently forms the basis of modern climate theory…
Global Temperature Trend Has Cooled Over The Past 6500 Years, Scientists Have Found – Climate -Science.press – July 24, 2026
Global Warming? What Global Warming? Our world has been following a general cooling trend, not only for the past 6,500 years as proposed in the article above, but from around 50 million years ago following the externally caused historic event known as the PETM and, it could be argued when looking at the much larger picture, for hundreds of millions of years before that (interspersed by occasional external events of a cosmic nature, all of which muddied the picture for a shorter or longer while). A gradual cooling interrupted by an approximately 20 million years of plateaued temperatures during the Oligocene and Miocene periods in what I consider to have been the most ideal living conditions ever to have occurred for life here on Earth. It was certainly the greenest of historic periods and one in which animal life flourished. Where also, global average temperatures averaged around +4 Celsius higher than modern times and with far less fluctuation. Also while atmospheric CO2 levels were at least double today’s concentrations. The perils of increased CO2 levels being yet another modern climate lie.
I make no apologies for reusing one of my favourite temperature charts again to illustrate these points. If this does not show global cooling, with not a trace of global warming, at least in the last 3 million years and as a general trend for the last 50 million years, then tell me – what does it show?
I like charts which explain things rather than simply showing statistical data. The chart below is one such chart which covers the same time period as the previous one with additional details which you may relate to some of the things I I have already said, or will mention. Beware of the temperature scale which represents anomaly, rather than actual temperatures, from some ‘zero’ point which, in this case, I take to be the current short-term global average of 14.5 °C (conveniently marked on the other chart for comparison). Its notations are not particularly accurate, though a useful reminder. For instance, the very important (to humanity) global tectonic rearrangements took place over an extended period stretching from at least 50 million years ago down to only 3 million years, with minor movements still ongoing.
Incidentally, and I will mention it just here before I forget, those tremendous movements may have had something to do with the start of the more, and growing, as temperatures become cooler over time, variability in the short-term extremes of highs and lows which I consider have fooled scientists into believing they constitute the basis of the false global warming narrative so prevalent today. You can see this on both charts. Of course the polar ice formations also took place within this period. Are these things interrelated, I wonder?

Deeper Into Ice-Age Stuff and Calling Out AI Blunders
This second article is quite interesting, and informative, although I do have issues with it. But since it is composed by western AI, which I do not trust at all – a clear case of Garbage In Garbage Out (GIGO) – I have no reluctance in voicing my opinion on where I see it fail on false facts (or just a few of those fails – not having time or space for a thorough examination).
Milankovitch Cycles, the Last Glacial Period, and Why Earth Is Still in an Ice Age – Climate -Science.press – Aug 19, 2026
The first examples of GIGO in this piece happen to occur from the very first statement of the piece. A discussion on what is an Ice Age, with direct reference to what we know as the ‘Last Ice Age’. This period holds no equivalence to the ‘Last Glacial Period’ as stated, which is merely an example of an unknown number of ‘Glacial Periods’ (and not necessarily the ‘Last’ one) within the current ‘Ice Age’. An age which began around 34 million years ago (although some estimates claim 45-50 million years ago) following the PETM event and at the same time as ice began to form at the Southern Pole of the planet and later at the Northern Pole.
Perhaps the most accurate statement in that first segment is made in this important, definitive, and self-explanatory quote (which is why I have elevated it to the status of a quotation)…
Earth is still technically in an ice age today because large ice sheets persist in Antarctica and Greenland (and smaller glaciers elsewhere).
As far as I am concerned, the quote above declaring the truth of this, we are still within the Pleistocene and our climate is still subject to the Late Cenozoic Ice Age, otherwise known as the Cenozoic Glaciation which began at least some 34 million years ago as the Southern Polar Ice began to form. We are indeed, and inarguably, still existing within an Ice Age. And what is more, we are about to enter yet another glacial period where both short-term and long-term trends – both of them cooling trends – will be working together to eventually, and most likely, bring us to the very bottom of our planet’s ultra-long-term temperature envelope. Although, taking at least another 100,000 years to reach that point, none of us alive right now are likely to see it or even feel its early frostiness. We have been through the rapid temporary warming of an inter-glacial and are now facing – or at least appear to be soon (and inevitably eventually) facing the long, slow, and not necessarily smooth transition to the bottom of the barrel of Earth’s temperature regime. I am both grateful and thankful for having lived my life during this brief warming period while also being far removed from the worst of the weather effects it has – whether naturally or through the foolishness of man – produced in recent times. Not that any of these events are truthfully as catastrophic as some claim them to be. The indecent profligacy of mankind has forced us to expand our settlements and geophysical interference far beyond the safe areas of the world, to compete in a fateful battle with the powers of nature. A struggle in which we never had hope of victory or even containment, without consequences.
The final statement in this opening part of this final article, I’m not sure about. Historic periods ending in ‘-cene’ are normally used only in relation to major developmental periods of Earth’s chronostratigraphic history. None of them have been previously subordinated to the role of covering a single interglacial period, as is stated to be the fate of the Holocene (the stratigraphic identity assigned to our current period). I think that somewhere down the line this will be realised to have been a terrible mistake of the deteriorating mind of modern man, possibly relying on projections rather than actual solid data. I am deeply thankful that the name ‘Anthropocene’ has been officially rejected by the ICS as an alternative to the Holocene, but I think the Holocene itself will disappear also if some valid reason is not found to extend it way past the short interglacial (now or soon closing) on which it is currently based. I know of no such valid reason for its existence. The Holocene itself is not a sufficiently important reason to declare the end of one Period (the Pleistocene) and the beginning of another (whatever may be its chosen name).
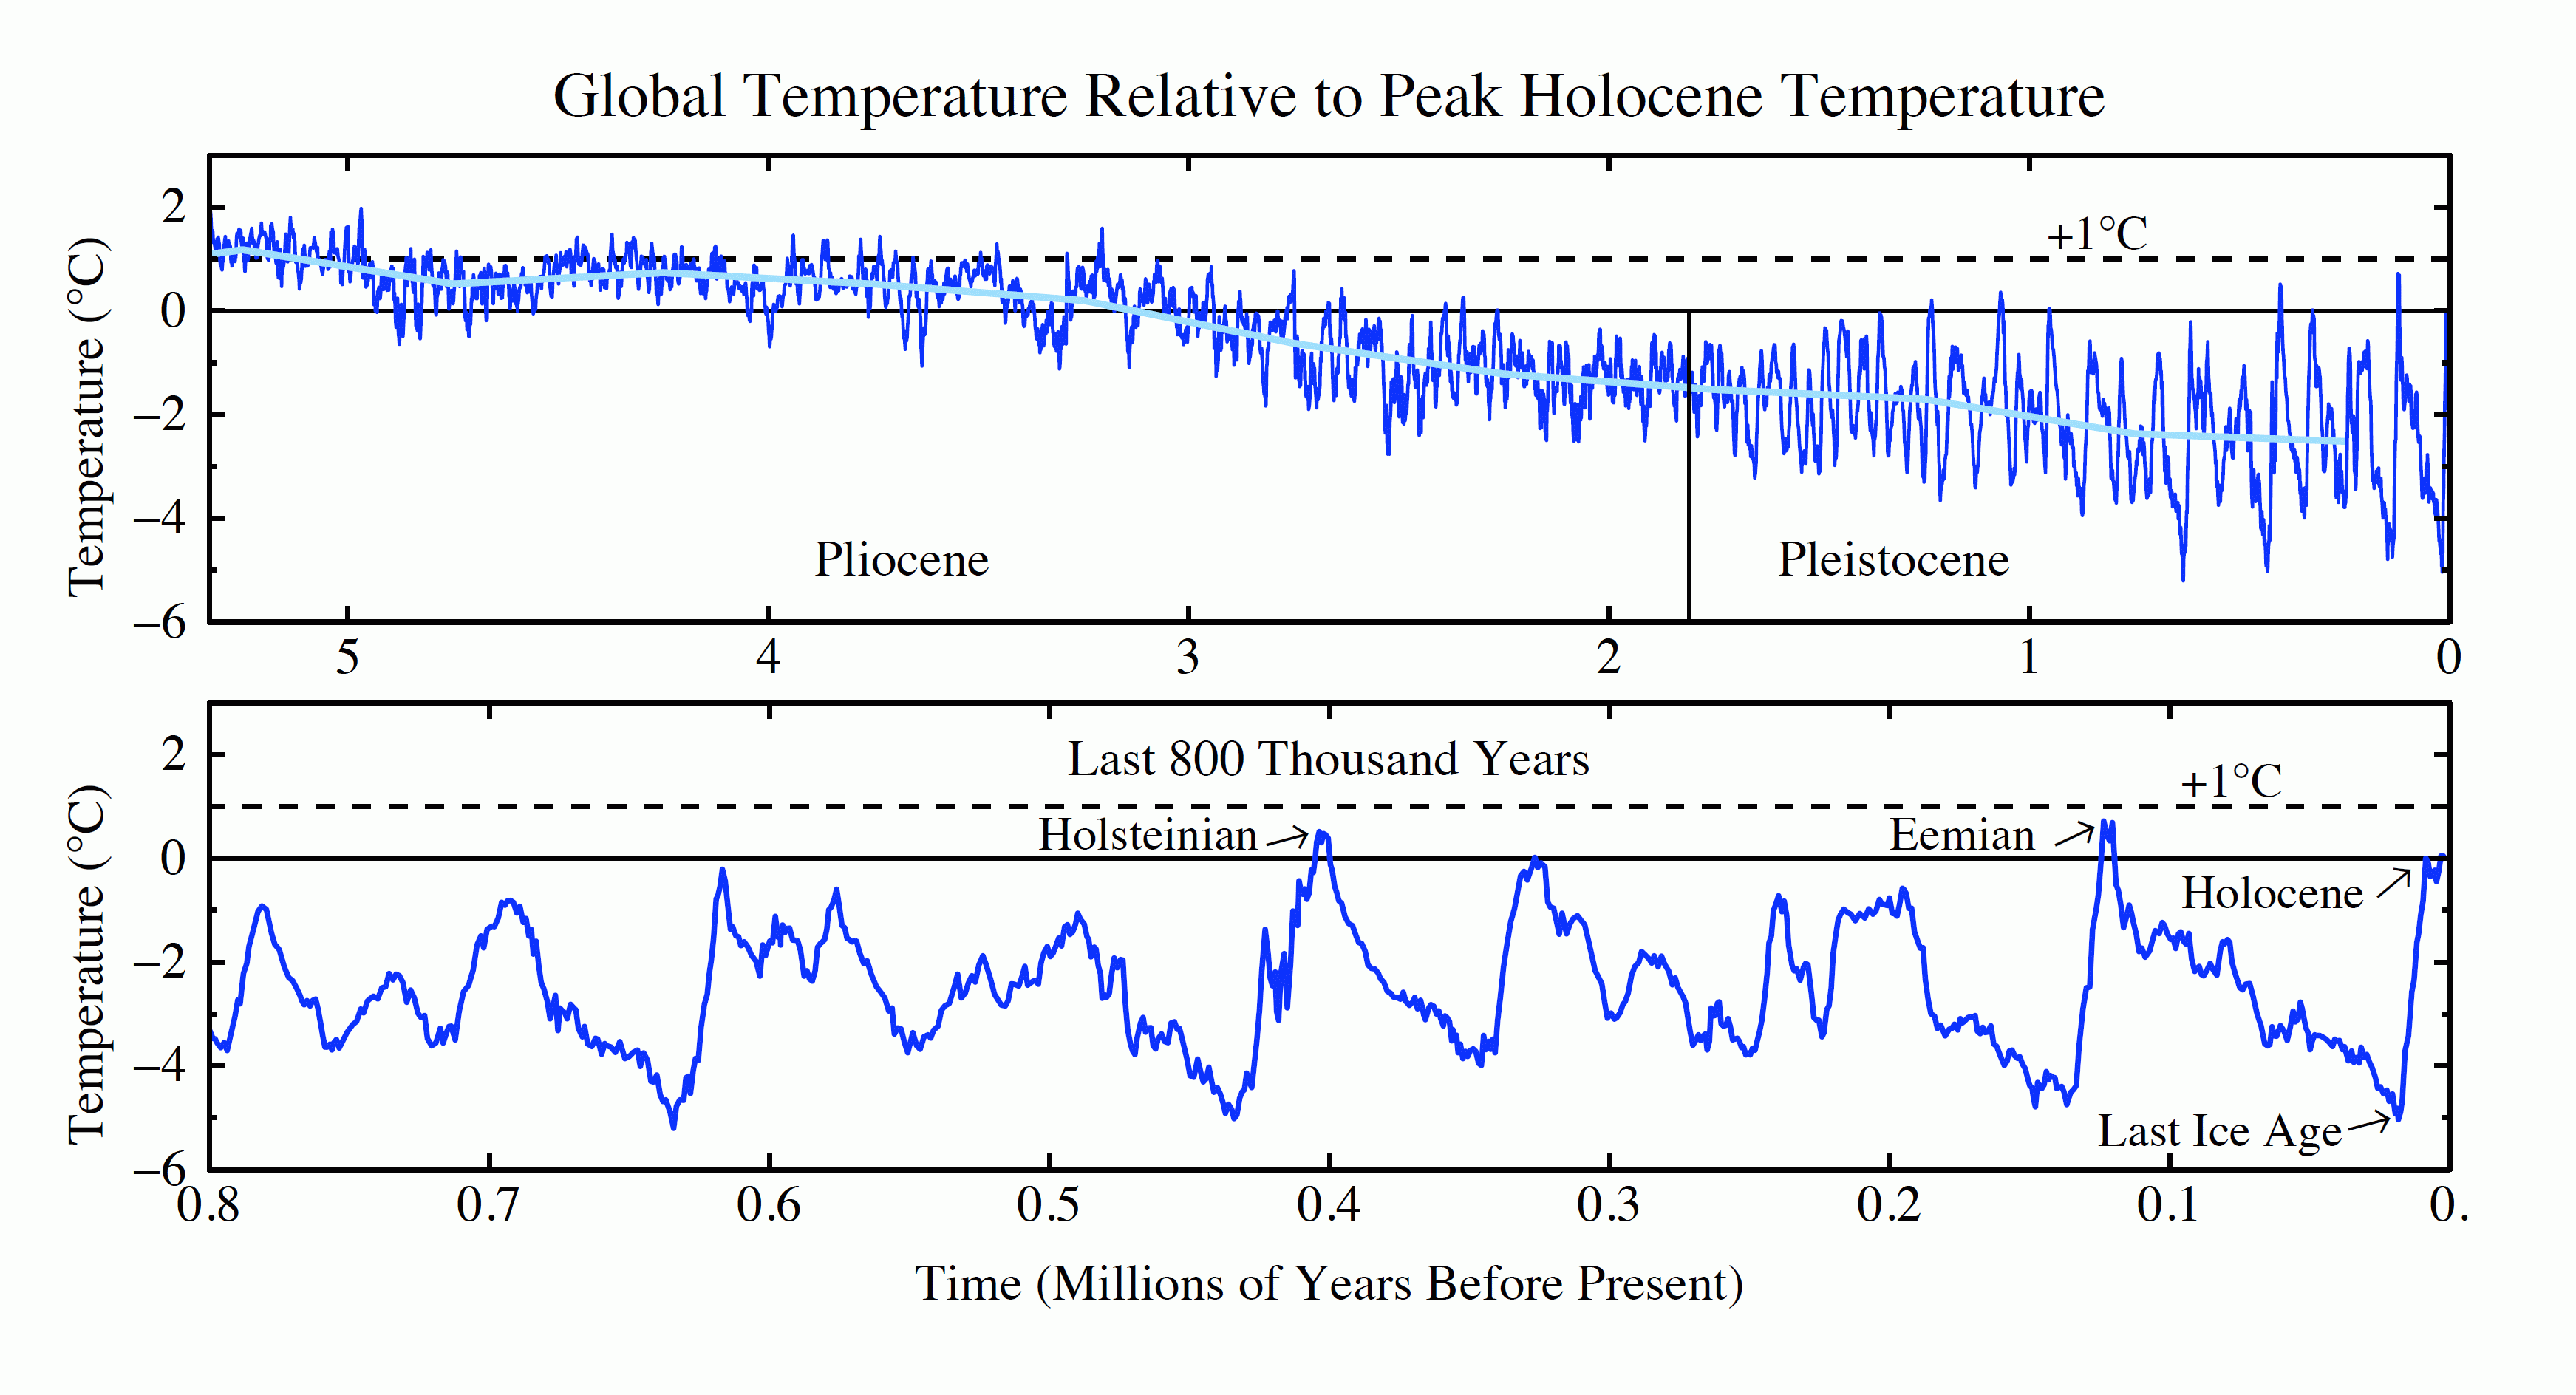
…and let me also say, before I grow tired of this game, such a reason for the naming and placement of the Holocene is not the ‘characteristic “sawtooth” pattern of slow ice buildup and rapid terminations’ mentioned in the quote below from the article [I know that sounds incorrect but it is not. ‘Ice buildup’ is a gradual downward slope in temperature to the right (the passage of time), whereas rapid terminations are a steep upward slope to the right – as clearly seen in the bottom half of the chart on the right].
Oh my goodness! I wish I didn’t have to keep showing these same few charts, but each time I do that it saves 1,000 words. Forgive me.
Over the last ~800,000 to 1 million years, the dominant glacial cycle length shifted to ~100,000 years (matching eccentricity), creating the characteristic “sawtooth” pattern of slow ice buildup and rapid terminations.
That “~800,000 to 1 million years” is, of course (and it is personally satisfying that other interested people have noticed it), the same period as depicted in the complete bottom part of the chart above. And also, in a more compressed form, the rightmost part of the top half. See how it all fits? There are real climate changes over time (always long times) and they always occur without the presence or interference of ‘industrial’ mankind. There is no reason to believe such a change has suddenly occurred (since 1850, or even the start of the dubious Holocene period – similar unnoticed periods having occurred many times in the past, with or without the presence of even ‘primitive’ mankind). Everything about the current climate, and I mean ‘everything’, is perfectly normal for this planet. Even the apparent ‘proximity’ to a, what some may call, major ‘freezing’ event at some ‘unforecastable’ time in the future. And, I suggest, similar minor climate perturbances must have occurred at each low mean temperature point in the planet’s history. There are a number of interesting points in this paragraph which I suggest might reward further scientific study – if such is possible.
There is only one further point I wish to make here. Only one? Well, I am already stretching the limits of patience and interest I think.
The headline image in this final article above is split into three sections, the middle one of which proposes a completely ice covered South America. I have seen another similar image previously. This is not a situation which South America has ever experienced, but of course that doesn’t matter to an AI which has been taught this as factual truth. It knows no difference.
Patagonia, at the Southern tip of the continent, was once, around 60 million years ago – when the most recent major movement of Earth’s continents was underway, finishing only some three million years ago with the joining of the two American land masses at Panama – at which time Patagonia did have ice coverage. Such conditions may occur again with the recent growth of Antarctic ice. Parts of the Andes range were also so covered at times, but the majority of the continent was never glaciated even though some Northern rocks are known to be associated with North America, which has been one of the most highly ice covered regions of the world.
This must be especially true when South America is shown on a world map which depicts the shape of the worlds as we know it today – even if that is meant to portray the world of 60 million years ago – which is an impossibilty. At that time the world was very different. The image I am discussing does show an India attached by a long, narrow, land bridge to Asia – also an impossibility. The Indian suc-continent was supposedly much further East than that at the time anchored on the same tectonic plate as Australia. How can such a mistake be made? Oh, yes – AI.
I won’t take this any further because a) I have lost interest now, and b) ther piece does contain some good information. Please take this as a warning that AI effectiveness, unless it at some stage gains a level of self-realisation and an ability to question its learning, is very dependent on who is teaching it. Western taught AI is all but relatively useless. Reflecting the generally now debased level of Western education.


Leave a Reply