
I tried to report this yesterday but got carried away on related matters which took on an importance of their own and, in any case, I realised I was actually a day early. So, here we are today, Sep 2, with the final day’s data from NSIDC in hand.
The chart of the month’s activity, courtesy NSIDC Interactive Sea Ice Chart, looks like this…
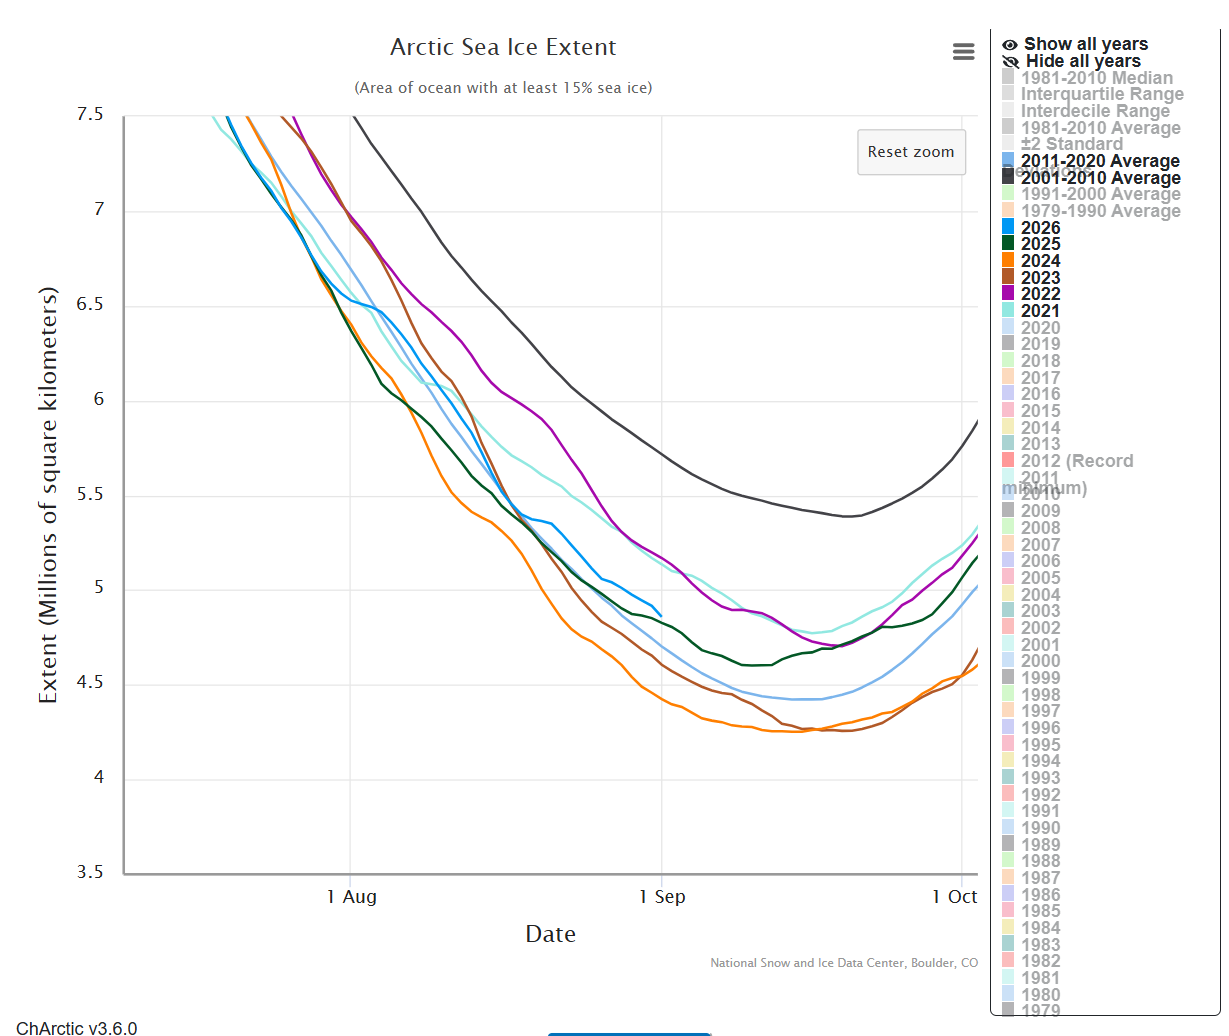
So what does this have to tell us? In simple terms it tells us that as at the end of August the average extent of sea ice still floating on the surface of the Arctic Ocean during the six years so far of the current decade (2021 – 2026), is at least 200,000 square kilometres more than during the entire period of the previous decade (2011 – 2020) on the same date in the year. This gives us confidence that at peak melt of the sea ice (in about two weeks) there will be more ice coverage remaining, on average, this current decade, than there was during that previous decade. So, what is the problem? We appear to have reached a turning point in the mild warming event – I surmise perhaps a final turning point to end the current interglacial period which began some 17,000 years ago and which (if this surmise is correct) peaked in temperature about one degree Celcius higher than today, at around 10,000 to 8,000 years ago. I repeat, ‘So, what is the problem?’.
We are now a full six years (as at any date between now and the end of the year) into the current decade (let’s call it the ‘Twenties’), and approaching, within the next two and a half weeks (roughly the middle of September), the peak of the Summer ice melting season in the Arctic. The period when there is the least amount of extent of ice, measured in millions of square kilometres, covering the surface of the Arctic Ocean. There is nothing unusual in that. It occurs at a similar date every year, for as far back as we are able to check. Now, since the actual date of the minimal ice level for any given year, is not predictable until it happens, a good and fixed precursor to that is where the level of sea stands as at the end of August. This data only becomes available, as it does every month, somewhere close to the end of the day on the first day of the following month – where I live, and even at some time on the next day in other parts of the world. In this case, on the first or second day of September, by the time it gets collected and charted by NSIDC. This is why the NSIDC interactive sea ice charts provide 12 fixed monthly points within the year, labelled the first day of the new month. So, if we want to be able to use those valuable charts for our own purposes, it mostly necessitates us to wait until the 2nd day of the month. Clever, really, if inconvenient (not happy? go make your own measurements :)).
Constituting even more cleverness, a decade’s worth of the annual ice extent data is scientifically deemed to provide a good indication of any change detectable in those measurements across the variability – and it is easy to see that there is considerable variability from year to year, especially at the peak seasonal points, over the ten years of each decade. That variability in the data, incidentally, being quite predictable over long periods of time to form a maximum variance around the two annual peak points of Winter ice growth (in March) and Summer ice melt (in September) as these peak points are approached, and at a minimum of variance, at the two active mode changeover points from growth to melt and vice-versa in the months around June and December.
The astute will have noticed that there is a connection (I think a direct connection) between the level of Northern ice variance at all four major points of the compass on our non-stop annual dance around the Sun’s Ecliptic Plane. There is noticeably minimal ice variance at the Equinoctial points of June and December; Contrasting with maximal ice variance at the Solstitial points of March and September. Quite remarkable, eh? And this goes some way to a vindication of what I was saying in yesterday’s post concerning the influence on our climate of celestial or rather cosmic and totally natural events related to our planet being part of fully formed star system, acting within at least two greater levels of systemic cosmic contacts – galaxial and galaxial groupings, plus perhaps an unknown number of independently moving types of largely unknown other universal objects.
The image below may go some way (not all) towards aiding an understanding of the points made above

The astute will also consider the irrelevance of everything some folk incorrectly (and sometimes maliciously or with bad intent) consider to be wrong with our current climate conditions, blaming these effects on us, their fellow humans, the ones who are constantly enticed or lured to not even think about such weighty matters, supposedly and conveniently far beyond our intellectual grasp, but instead to quietly accept, without question, our punishment as guilty perpetrators of climate damage. That may be an acceptable judgement to some, meant to drive us towards drastic remedial action, but ‘not this little black duck’! I consider there to be absolutely no necessity for remedial action to save our planet. To me, the planetary climate is behaving quite normally, and entirely within its set boundaries. There are other factors in play. But nothing that we can, or should, do anything about.
And this brings me to make a final point which I failed to emphasize sufficiently in my previous post yesterday. Generally speaking, it occurs to me, the arguments used by the proponents of climate blame and climate action are not related to the causes of climate change at all, but to the visual effects supposedly associated (in the minds of the proponents) with those changes. Often the effects are not related to any form of climate change, but to other factors instead. Climate change does not cause storms, make floods or landslides, ruin crops, start wildfires, set off volcanos, initiate earthquakes, kill people or animals, start or end wars, or bring about pandemics. These things and a potential list of other things which may be attributable by humans to climate change, are always the result of something outside the purview of climate change. If something occurring on or below the surface of the planet is having an effect on humans, there is a higher than average chance that humans had something to do with that – perhaps deliberately, perhaps accidentally, perhaps ignorantly, to do with that. And in most cases there is something humans can do to mitigate or erase the inconvenience of suffering whatever the resulting damage or irritation may be.
Books could be written, and probably already have, on how humans can come to live on terms acceptable to themselves and to their environment in relative safety. Absolute safety and absolute choice were never granted to humanity. It is all about compromise. If something hurts you where you are, move somewhere else. It’s very simple. The problem is that humans have turned from a nomadic lifestyle to one of fixed location for one reason or another. We have become inflexible, both in our attitudes and in where we locate or hold community – and in the type of community we hold. All of that may be the end of us if we cannot change. It is not the fault of climate change if that should occur, but of our own inflexible attitude.
It is also a question of size, organisation, and expectations. But I will not go into that here.
I will end this there.


Leave a comment